R codes for Turkish movies more then 2500 reviews from https://m.imdb.com is as follows. By using these codes you can get a data frame “Movies” with 5 variable “Title, Year, Duration, Rating, Votes” and 469 observations. For 1. and 2. part of assignment 2.
library(tidyverse)
── Attaching core tidyverse packages ──────────────────────── tidyverse 2.0.0 ──
✔ dplyr     1.1.3     ✔ readr     2.1.4
✔ forcats   1.0.0     ✔ stringr   1.5.0
✔ ggplot2   3.4.4     ✔ tibble    3.2.1
✔ lubridate 1.9.3     ✔ tidyr     1.3.0
✔ purrr     1.0.2
── Conflicts ────────────────────────────────────────── tidyverse_conflicts() ──
✖ dplyr::filter() masks stats::filter()
✖ dplyr::lag()    masks stats::lag()
ℹ Use the conflicted package (<http://conflicted.r-lib.org/>) to force all conflicts to become errors
library(rvest)
Attaching package: 'rvest'

The following object is masked from 'package:readr':

    guess_encoding
                             Title Year Duration Rating Votes
466                 Cumali Ceber 2 2018      100    1.2 10227
467                          Müjde 2022      288    1.2  9920
468              15/07 Safak Vakti 2021       95    1.2 20605
469 Cumali Ceber: Allah Seni Alsin 2017      100    1.0 39265
470                           Reis 2017      108    1.0 73971
Movies%>%filter(Title=="Kaybedenler Kulübü")
               Title Year Duration Rating Votes
1 Kaybedenler Kulübü 2011      105    7.5 25116
Movies%>%filter(Title=="Anadolu Kartallari")
               Title Year Duration Rating Votes
1 Anadolu Kartallari 2011      120    6.2  5632
Actually when we look at movies at the top five, raters likes comedy and laughing. I watched some of them and even though most of them are old films they still make people laugh. These are raters evaluations and we can only rate as they do, everyone has exclusively styles.
At bottom part we can see political movies. Maybe raters are not interested politic or they don’t believe their content…
Two of my favorite movies find their position in the list but it is not important. I know some extras from one of these movies. They were good guys.
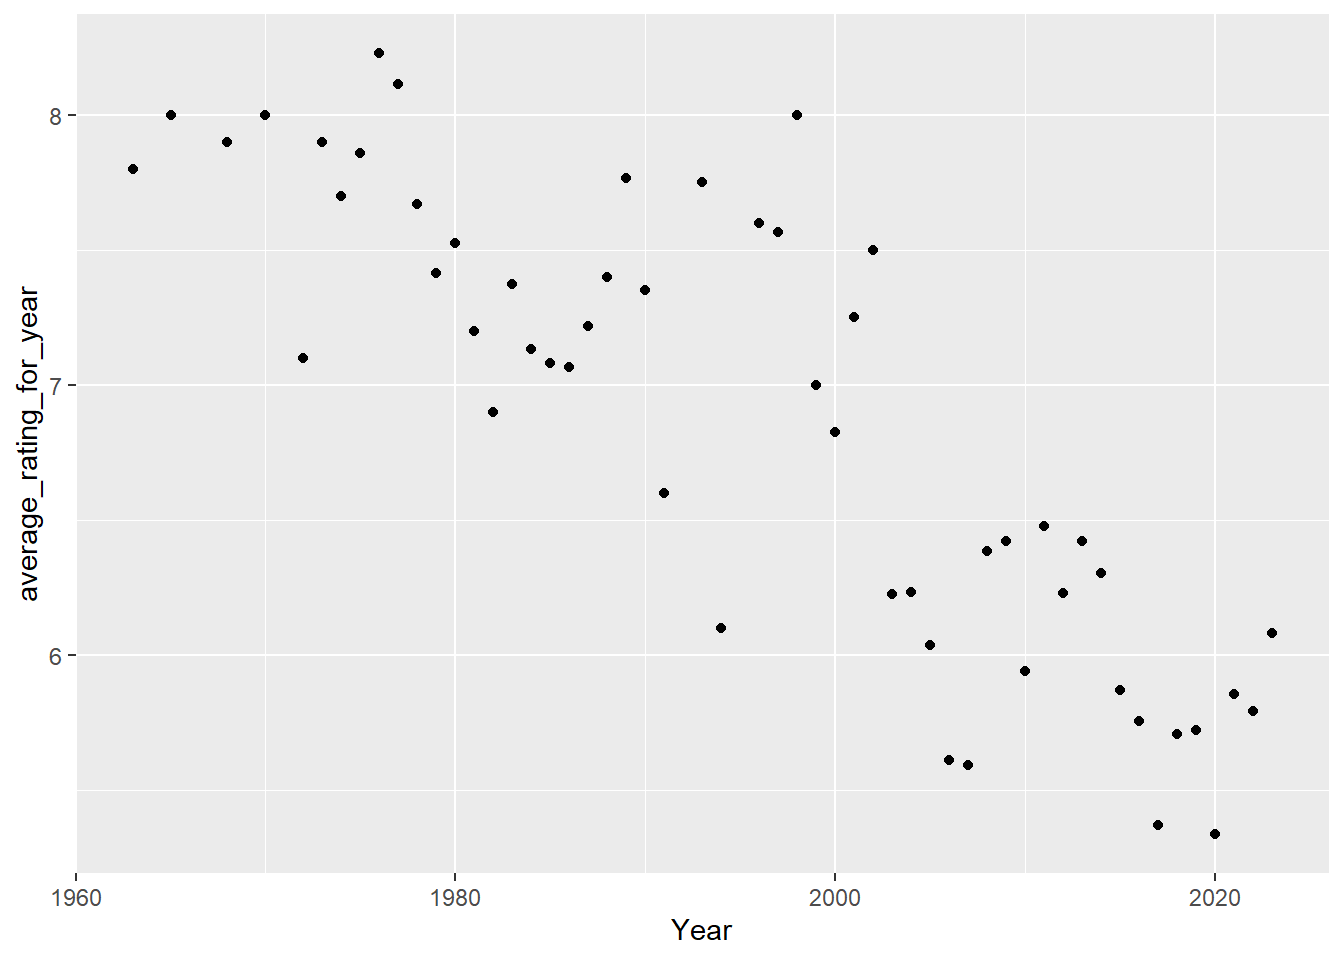
Below you can find Turkish movies average ratings for each year
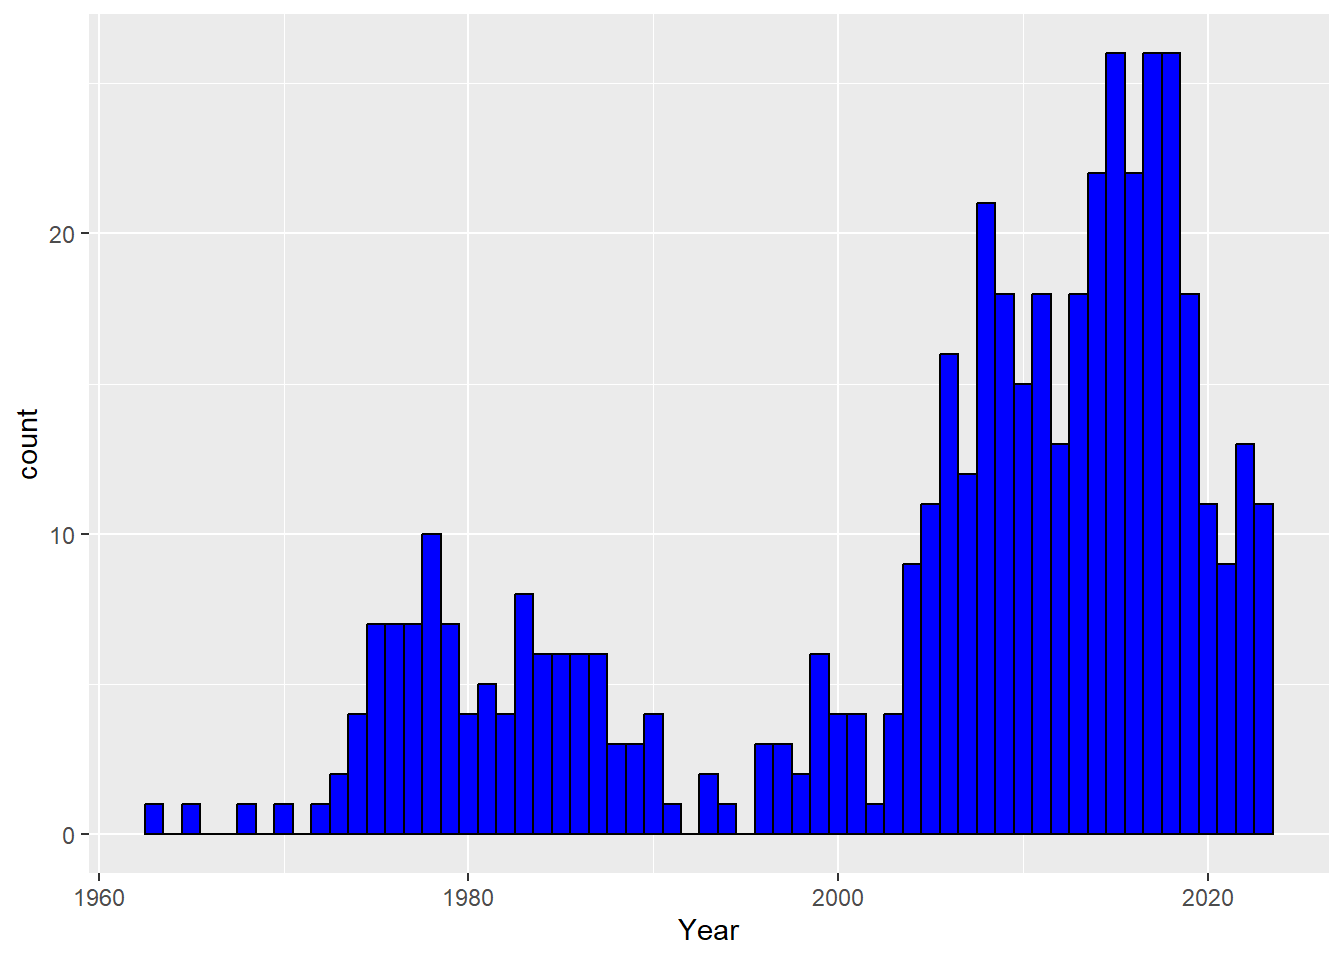
plot_for_total_movies_for_years=Movies %>%group_by(Year) ggplot(plot_for_total_movies_for_years,aes(Year)) +geom_histogram(binwidth =1,fill ="blue", col ="black")
p=as.factor(Movies$Year)Movies=cbind(Movies,p)
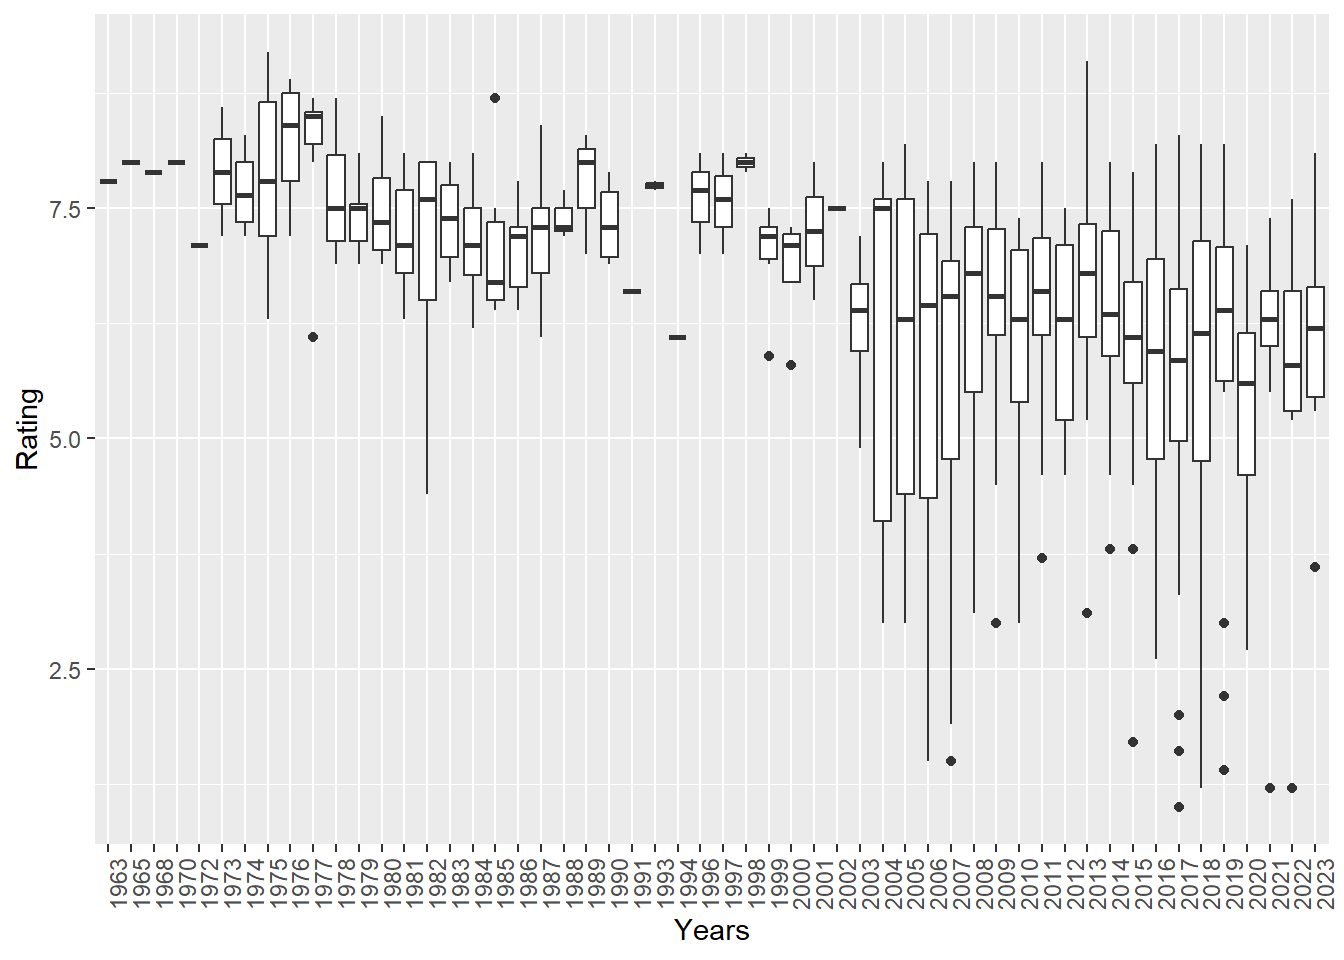
Below you can see box plot of ratings over years
Movies %>%ggplot(aes(p,Rating),)+geom_boxplot()+theme(axis.text.x =element_text(angle =90, hjust =1))+xlab("Years")
Looking only average of ratings over years may be misleading because of number of movies each year can change. With technological development, number of movies for each year increases and it can be seen easily above. Even though rating average decrease for years, number of movies increase.
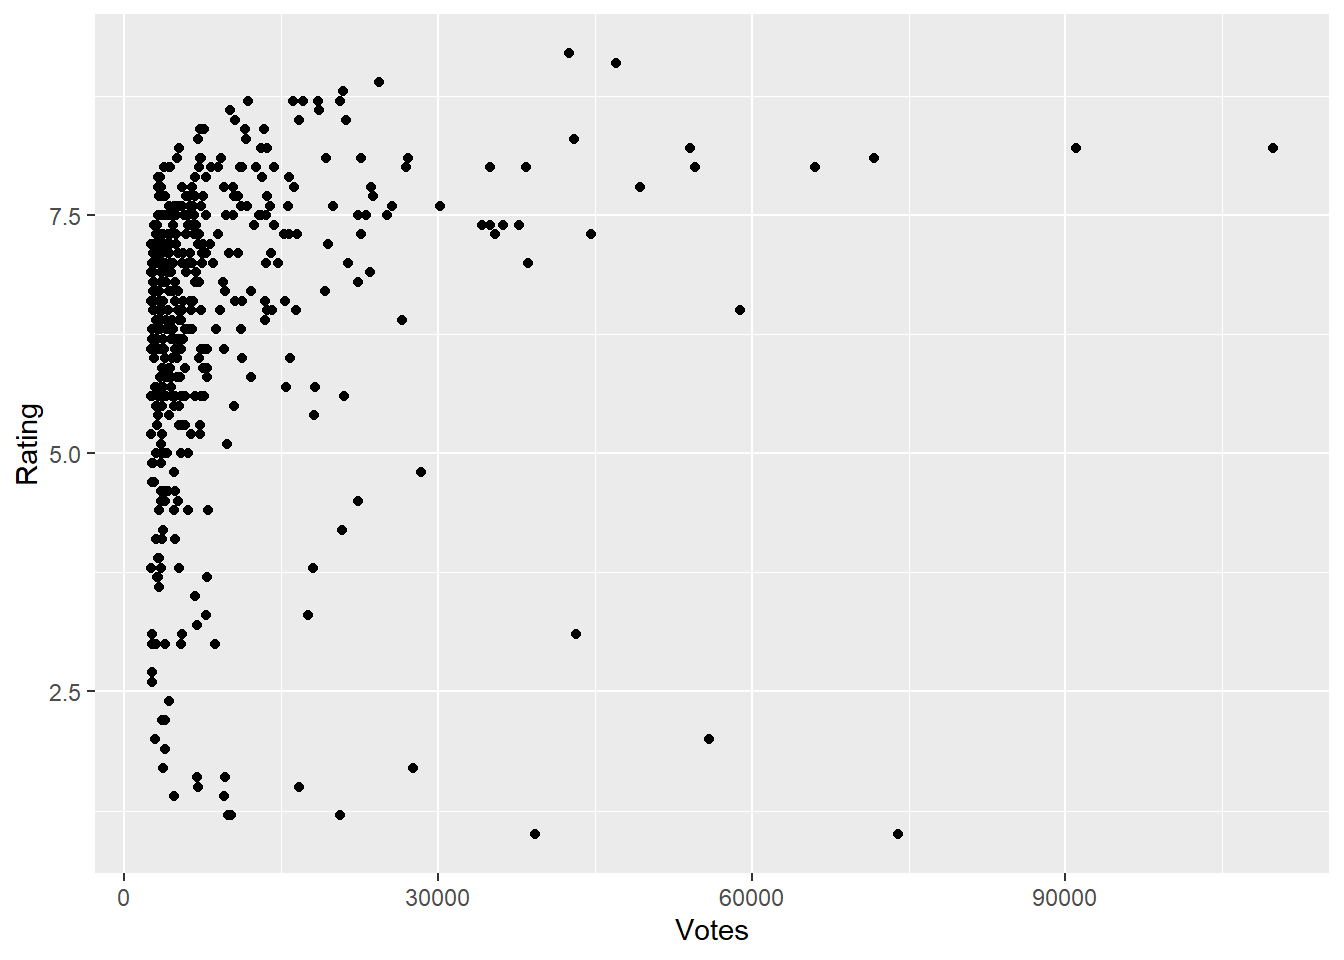
Correlation between votes and rating;
ggplot(Movies,aes(Votes,Rating))+geom_point()
cor(Votes,Rating)
[1] 0.1306267
From plot and result of cor() function we can say there is no explicitly correlation between votes and ratings.
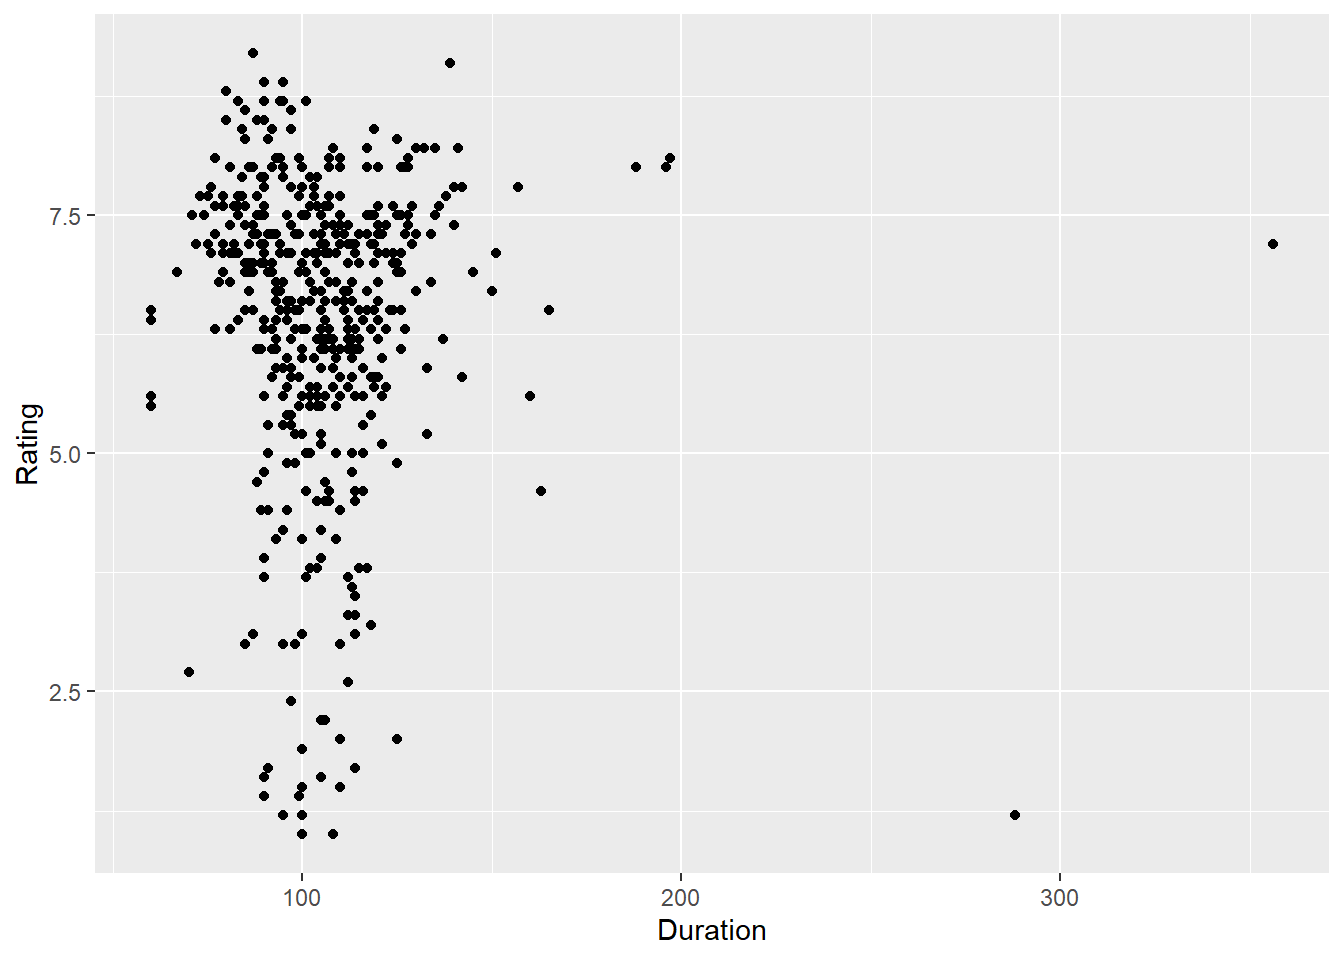
Correlation between duration and rating;
ggplot(Movies,aes(Duration,Rating))+geom_point()
cor(Duration,Rating)
[1] -0.03190838
From plot and result of cor() function we can say there is no explicitly correlation between duration and ratings.
              names_for_1000 year
1   Yedinci Kogustaki Mucize 2019
2                 Kis Uykusu 2014
3      Nefes: Vatan Sagolsun 2009
4  Ayla: The Daughter of War 2017
5             Babam ve Oglum 2005
6                Ahlat Agaci 2018
7    Bir Zamanlar Anadolu'da 2011
8                     Eskiya 1996
9                   G.O.R.A. 2004
10                 Vizontele 2001
11  Her Sey Çok Güzel Olacak 1998
              names_for_1000 year Duration Rating Votes    p
1  Ayla: The Daughter of War 2017      125    8.3 42972 2017
2             Babam ve Oglum 2005      108    8.2 91008 2005
3   Yedinci Kogustaki Mucize 2019      132    8.2 54107 2019
4                     Eskiya 1996      128    8.1 71688 1996
5   Her Sey Çok Güzel Olacak 1998      107    8.1 27104 1998
6                Ahlat Agaci 2018      188    8.0 26961 2018
7                   G.O.R.A. 2004      127    8.0 66008 2004
8                 Kis Uykusu 2014      196    8.0 54598 2014
9      Nefes: Vatan Sagolsun 2009      128    8.0 34986 2009
10                 Vizontele 2001      110    8.0 38389 2001
11   Bir Zamanlar Anadolu'da 2011      157    7.8 49320 2011
High rated 11 movies in two data frame are same movies but most probably IMDB uses different parameters to determine top 1000 movies. Rating and votes may not be key element to determine top 1000 list.