Set Covering

Minimum Set Cover

Problem

Minimum number of facilities with coverage distance Dmax, co-located with demand points, to serve all demand points.

\[ \begin{split} \begin{align} &N: \text{number of demand points} \\ &d_{ij}: \text{euclidian distance between locations i and j} \\ &y_{j}: 1, \text{if a facility is opened at location j} \\ &x_{ij} : 1, \text{if node i is served by facility at j} \\ \end{align} \end{split} \\ \\ \]

\[ \begin{split} \begin{align} &\text{minimize} \ \sum_{j \in N} y_{j} \\ &\text{st} \\ &\\ &\sum_{j \in N} x_{ij} = 1 \qquad \qquad \qquad\ \ \forall i \in N \\ &y_{j} \ge x_{ij} \qquad \qquad \qquad \qquad \forall i \epsilon N, \forall j \in N \\ &\sum_{j \in N} x_{ij}d_{ij} \le Dmax \qquad \quad\ \forall i \in N\\ & x_{ij}, y_{j} \ \in \ \{0,1\} \qquad \qquad \quad \forall i \in N, \forall j \in N \\ \end{align} \end{split} \\ \\ \]

import pandas as pd
import numpy as np
import gurobipy as gp
from gurobipy import GRB
import matplotlib.pyplot as plt
from scipy.spatial.distance import cdist

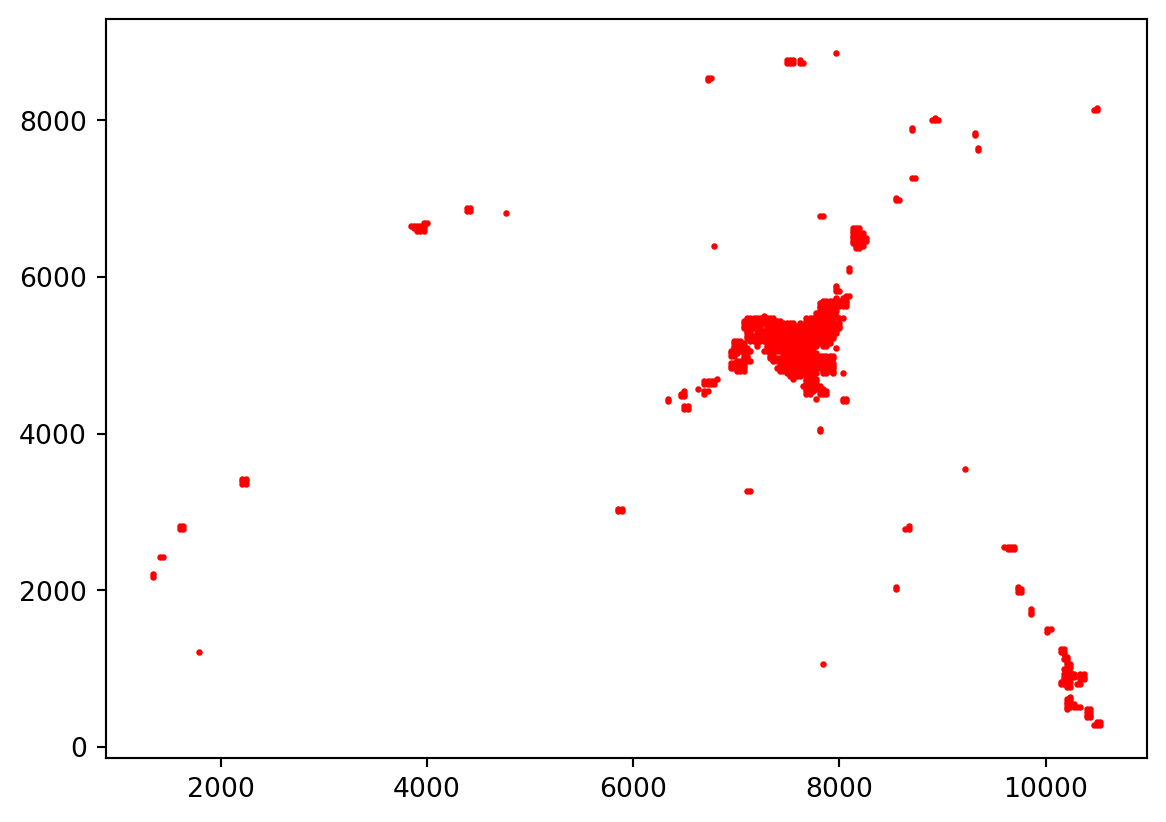
nLocs = pd.read_excel('NodeLocations.xlsx', sheet_name = 'MoleStNicholas').to_numpy()
N = len(nLocs)
d = cdist(nLocs, nLocs)
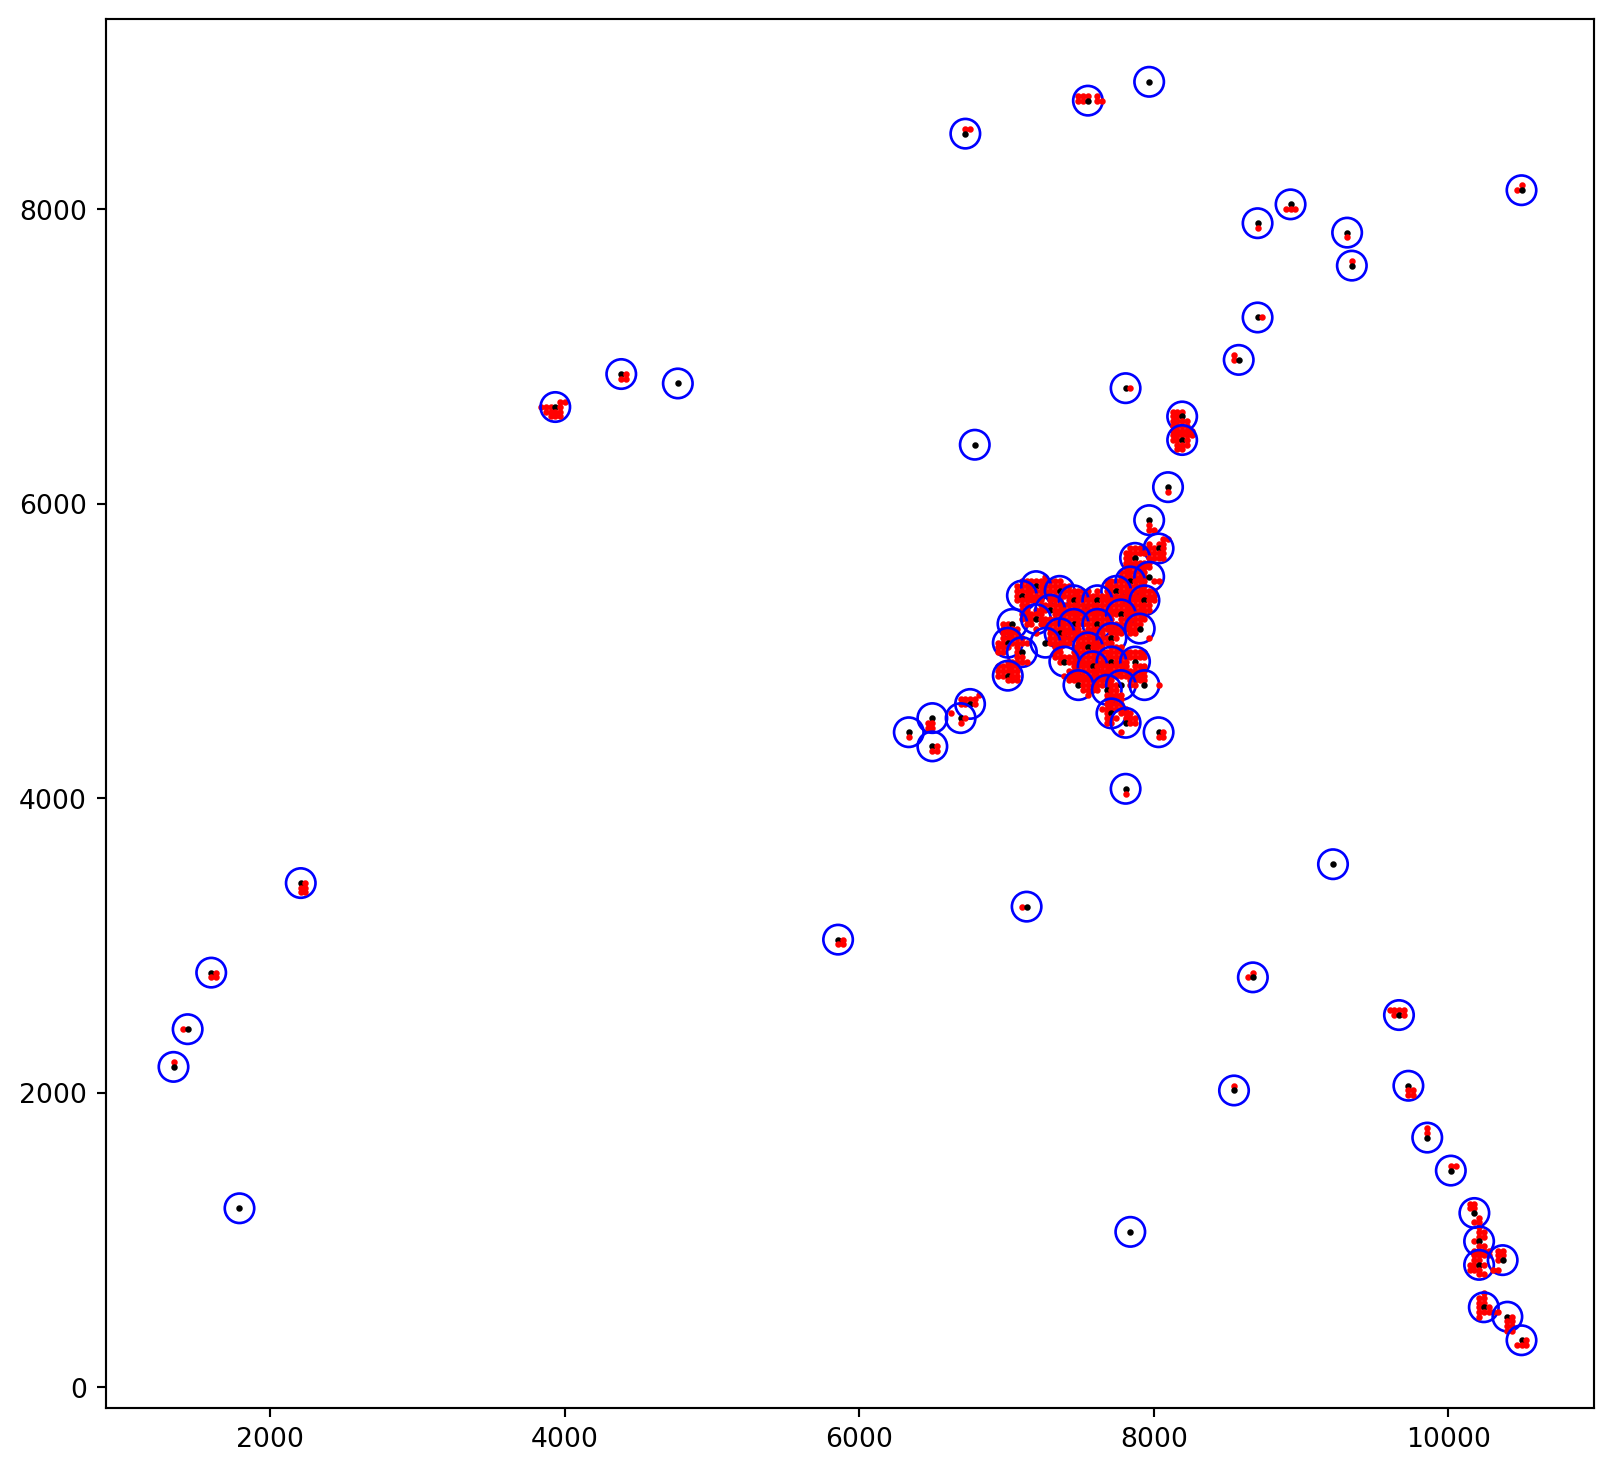
Dmax = 100

for i in range(N):
    plt.scatter(nLocs[i,0], nLocs[i,1], color = 'red', s = 2)

#model
model = gp.Model('MinSetCover-1')

#dvar
x = model.addVars(N,N, vtype = gp.GRB.BINARY, name = 'x')
y = model.addVars(N, vtype = gp.GRB.BINARY, name = 'y')

#obj
model.setObjective(gp.quicksum(y[i] for i in range(N)), GRB.MINIMIZE)

#constr
for i in range(N):
    model.addConstr(gp.quicksum(x[i,j] for j in range(N)) == 1)
    
for i in range(N):
    for j in range(N):
        model.addConstr(x[i,j] <= y[j])
        
for i in range(N):
    model.addConstr(gp.quicksum(x[i,j]*d[i,j] for j in range(N)) <= Dmax)

    
model.setParam('TimeLimit', 120)
#model.write('MinSetCover.lp')
model.optimize()
Set parameter Username
Academic license - for non-commercial use only - expires 2024-11-09
Set parameter TimeLimit to value 120
Gurobi Optimizer version 10.0.3 build v10.0.3rc0 (win64)

CPU model: 11th Gen Intel(R) Core(TM) i5-1135G7 @ 2.40GHz, instruction set [SSE2|AVX|AVX2|AVX512]
Thread count: 4 physical cores, 8 logical processors, using up to 8 threads

Optimize a model with 739599 rows, 738740 columns and 2950665 nonzeros
Model fingerprint: 0xfc528306
Variable types: 0 continuous, 738740 integer (738740 binary)
Coefficient statistics:
  Matrix range     [1e+00, 1e+04]
  Objective range  [1e+00, 1e+00]
  Bounds range     [1e+00, 1e+00]
  RHS range        [1e+00, 1e+02]
Found heuristic solution: objective 576.0000000
Presolve removed 725159 rows and 724301 columns
Presolve time: 2.51s
Presolved: 14440 rows, 14439 columns, 41453 nonzeros
Found heuristic solution: objective 454.0000000
Variable types: 0 continuous, 14439 integer (14439 binary)

Root simplex log...

Iteration    Objective       Primal Inf.    Dual Inf.      Time
   17553    8.0253314e+01   4.315775e+02   0.000000e+00      5s
   23251    8.0579933e+01   0.000000e+00   0.000000e+00      7s

Root relaxation: objective 8.057993e+01, 23251 iterations, 4.01 seconds (2.26 work units)

    Nodes    |    Current Node    |     Objective Bounds      |     Work
 Expl Unexpl |  Obj  Depth IntInf | Incumbent    BestBd   Gap | It/Node Time

     0     0   80.57993    0 4043  454.00000   80.57993  82.3%     -    9s
H    0     0                     309.0000000   80.57993  73.9%     -    9s
H    0     0                     109.0000000   80.57993  26.1%     -    9s
H    0     0                     107.0000000   80.57993  24.7%     -    9s
H    0     0                     105.0000000   80.57993  23.3%     -    9s
H    0     0                      92.0000000   80.57993  12.4%     -   13s
     0     0   80.58013    0 4063   92.00000   80.58013  12.4%     -   14s
H    0     0                      88.0000000   80.58013  8.43%     -   14s
     0     0   80.58013    0 4089   88.00000   80.58013  8.43%     -   14s
     0     0   80.75072    0 4061   88.00000   80.75072  8.24%     -   22s
     0     0   80.75072    0 4083   88.00000   80.75072  8.24%     -   22s
H    0     0                      87.0000000   80.86783  7.05%     -   32s
H    0     0                      86.0000000   80.86783  5.97%     -   32s
H    0     0                      83.0000000   80.86783  2.57%     -   32s
     0     0   80.86783    0 4206   83.00000   80.86783  2.57%     -   32s
     0     0   80.86783    0 4379   83.00000   80.86783  2.57%     -   33s
     0     0   80.87154    0 4227   83.00000   80.87154  2.56%     -   41s
     0     0   80.94153    0 4228   83.00000   80.94153  2.48%     -   41s
     0     0   80.94678    0 4240   83.00000   80.94678  2.47%     -   45s
     0     0   80.94678    0 4101   83.00000   80.94678  2.47%     -   47s
     0     2   80.94678    0 4101   83.00000   80.94678  2.47%     -   71s
     3     8   80.94678    2 4429   83.00000   80.94678  2.47%  6190   75s
    19    24   81.15542    5 3652   83.00000   80.94678  2.47%  2801   80s
    60    33   81.28425    4 3404   83.00000   80.94678  2.47%  1419   86s
    83    50   81.53238    5 3165   83.00000   80.94678  2.47%  1346   90s
   134    50     cutoff   13        83.00000   80.94678  2.47%  1126   96s
   169    67   81.90021    9 2731   83.00000   80.94678  2.47%  1098  100s
   205    71   81.13124    6 4331   83.00000   80.94678  2.47%  1057  105s
   230    81   81.98003   11 3105   83.00000   80.94678  2.47%  1072  110s
   264    88   81.32847    6 3915   83.00000   81.03924  2.36%  1028  115s
   302   103     cutoff   11        83.00000   81.03924  2.36%  1020  120s

Cutting planes:
  Zero half: 14

Explored 303 nodes (385526 simplex iterations) in 120.17 seconds (82.00 work units)
Thread count was 8 (of 8 available processors)

Solution count 10: 83 86 87 ... 454

Time limit reached
Best objective 8.300000000000e+01, best bound 8.200000000000e+01, gap 1.2048%
fig,ax = plt.subplots(figsize=(10,10))
ax.set_aspect('equal')
for i in range(N):
    if y[i].x > 0.9:
        ax.scatter(nLocs[i,0], nLocs[i,1], color = 'black', s = 2)
        circle = plt.Circle([nLocs[i,0], nLocs[i,1]], Dmax, color = 'blue', fill = False)
        ax.add_artist(circle)
    else:
        ax.scatter(nLocs[i,0], nLocs[i,1], color = 'red', s = 2)

Back to top