IS THERE INCREASE TREND IN SPECIFIC PERIODS FOR SPECIFIC GROUPS?
WHY DO WE SEE FLUCTUATION IN SOME GROUP?
In our society and through world there is a belief which claims convicts have low educational level. According to this belief, thanks to education, some values can be gained by children during school years. Is it really so? In this work we want to show some analysis and illuminate if there is a correlation between education level and probability of committing a crime with the data of TÜİK which include education level of convicts of Turkish prisons between 1990-2020. Our data include education level as variable (Illiterate, Literate but not Graduated from a school, Primary School, Primary Education, Junior High School and Vocational School at High School Level, Higher Education, Unknown) and years 1990-2020 as observations. Lines in each plot which are parallel to x axis point out average value of table’s observations.
Code
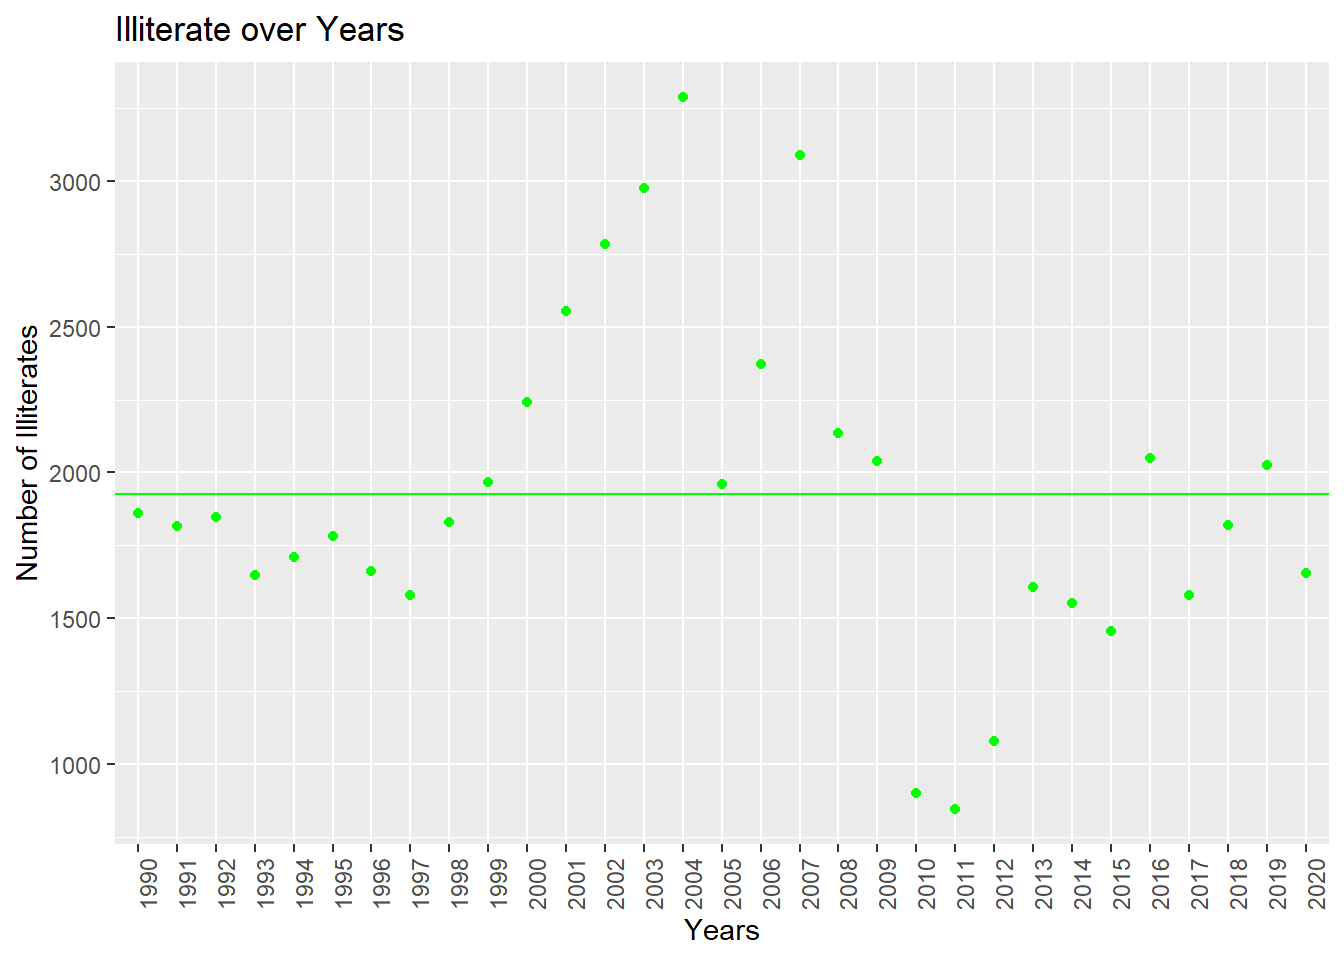
library(tidyverse)load("~/Github/emu430-fall2023-team-data_criminals/data_criminals.RData")average_illiterate=mean(data_criminals$Illiterate)ggplot(data_criminals,aes(...1,Illiterate))+geom_point(color="green")+theme(axis.text.x =element_text(angle =90, hjust =1))+labs(title ="Illiterate over Years", x ="Years", y ="Number of Illiterates")+geom_hline(yintercept = average_illiterate, col ="green")
As seen on the plot between 1997-2004 years there is a increase trend and in 2010, 2011, 2012 are lowest numbers for illiterate. We can see fluctuation over the years and interestingly compared to other education levels, number of illiterates has lowest average. Rates of illiterates of Turkey is important to make a interpretation and it is subject of another research. Our data provide only education level of convicts.
Code
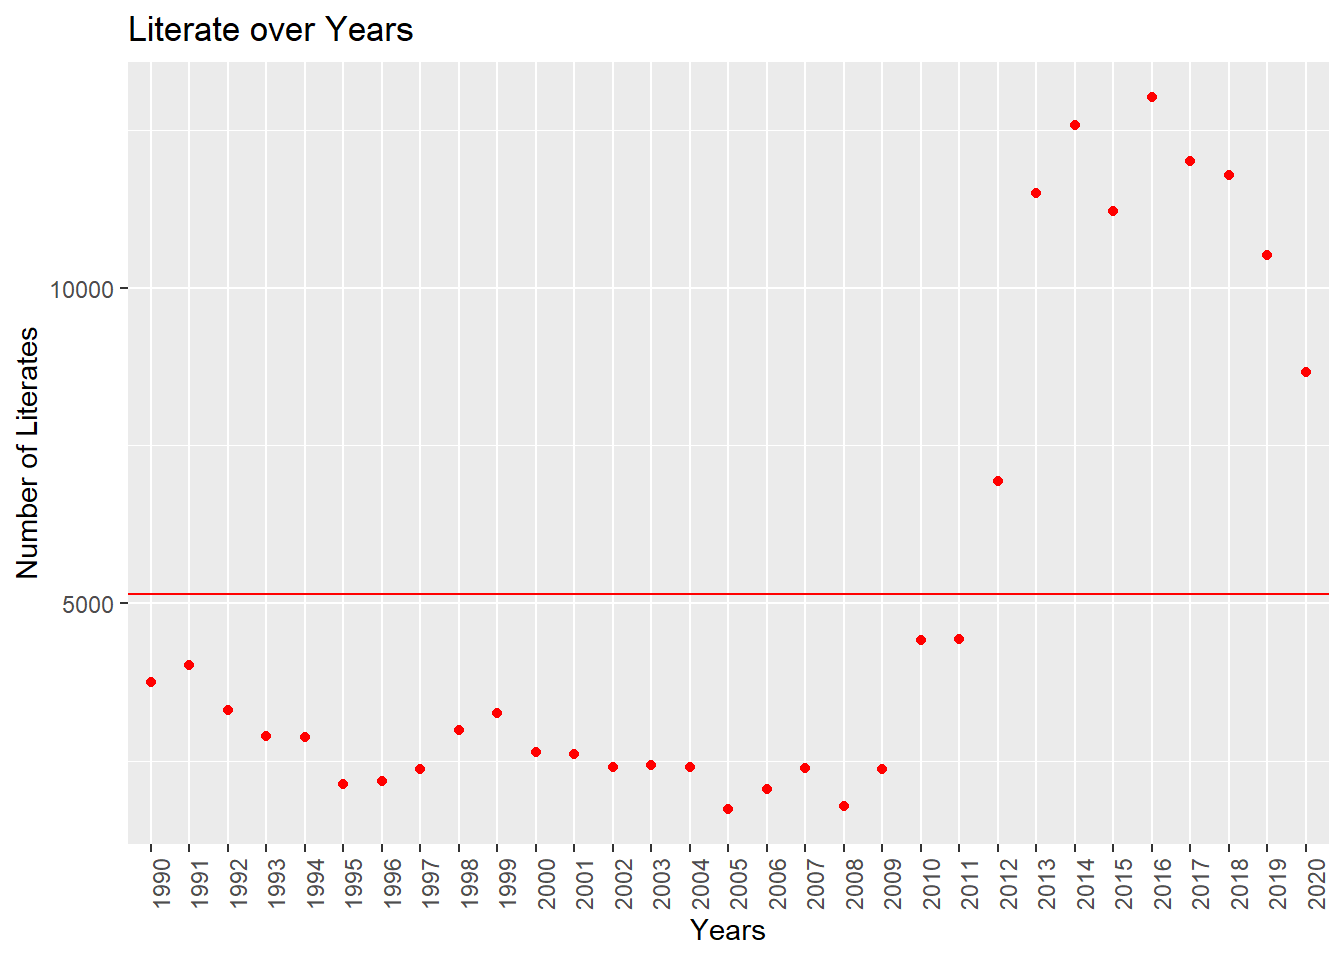
average_literates=mean(data_criminals$`Literate but not Graduated from a School`)ggplot(data_criminals,aes(...1,data_criminals$`Literate but not Graduated from a School` ))+geom_point(color="red")+theme(axis.text.x =element_text(angle =90, hjust =1))+labs(title ="Literate over Years", x ="Years", y ="Number of Literates")+geom_hline(yintercept = average_literates, col ="red")
When we look at the number of literates who have not graduated from a school, we can see increase after 2009 and their average find its position at third.
Code
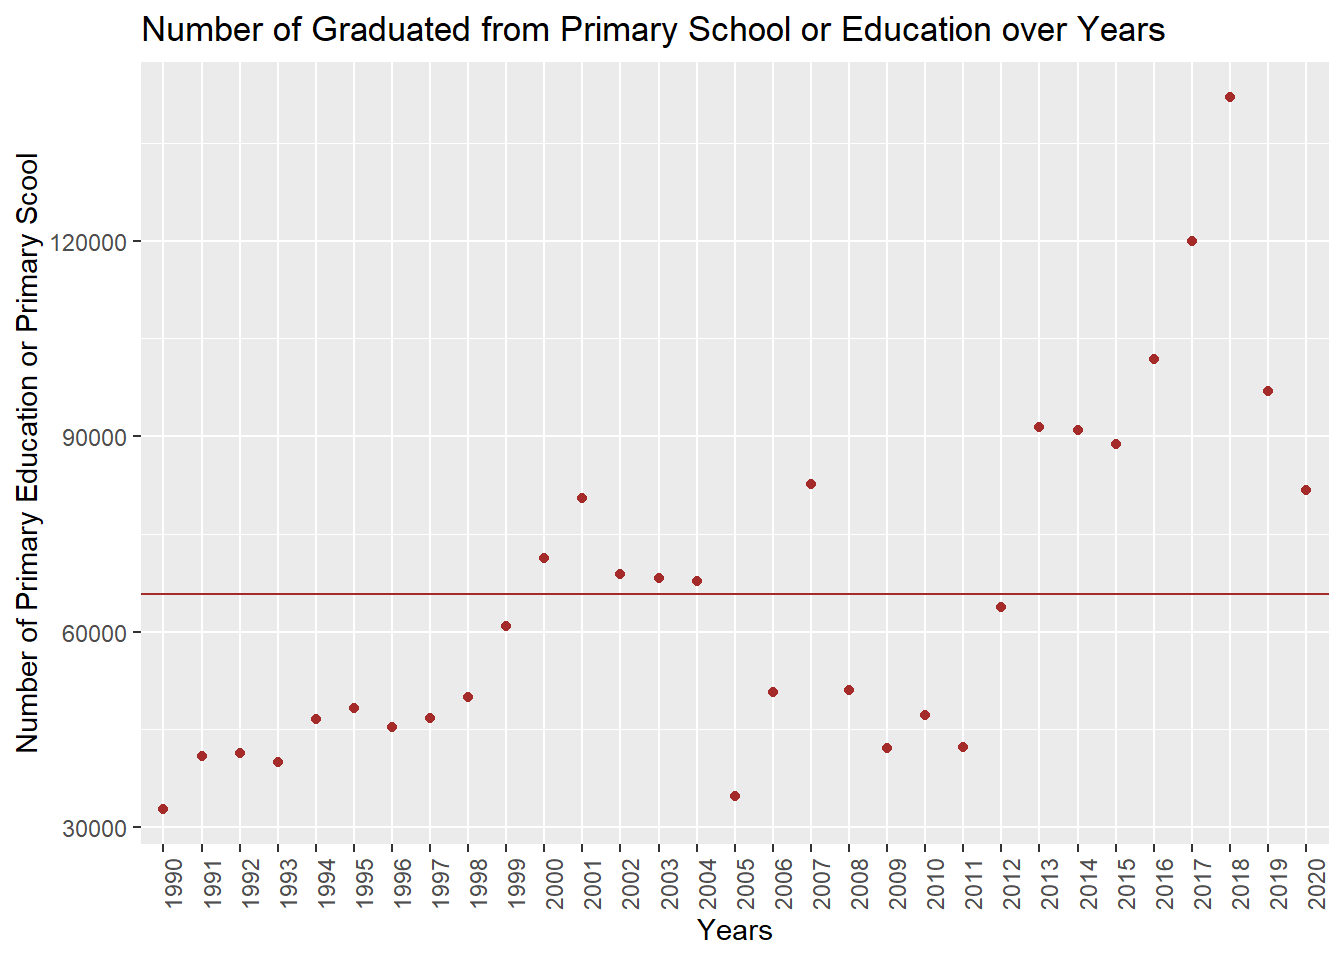
data_criminals$`Primary Education`[is.na(data_criminals$`Primary Education`)] <-0p=data_criminals%>%mutate(Primary=`Primary School`+`Primary Education`)average_primary=mean(p$Primary)ggplot(p,aes(...1,Primary))+geom_point(color="brown")+theme(axis.text.x =element_text(angle =90, hjust =1))+labs(title ="Number of Graduated from Primary School or Education over Years", x ="Years", y ="Number of Primary Education or Primary Scool")+geom_hline(yintercept = average_primary, col ="brown")
In our data frame Primary Education and Primary School has 2 different column. We combined two column into one column as Primary. We can see fluctuation over years and increase after 2016. Most probably, sharp decline after 2018 results from regulation in execution law because of COVID-19 pandemic. This group has the highest average.
Code
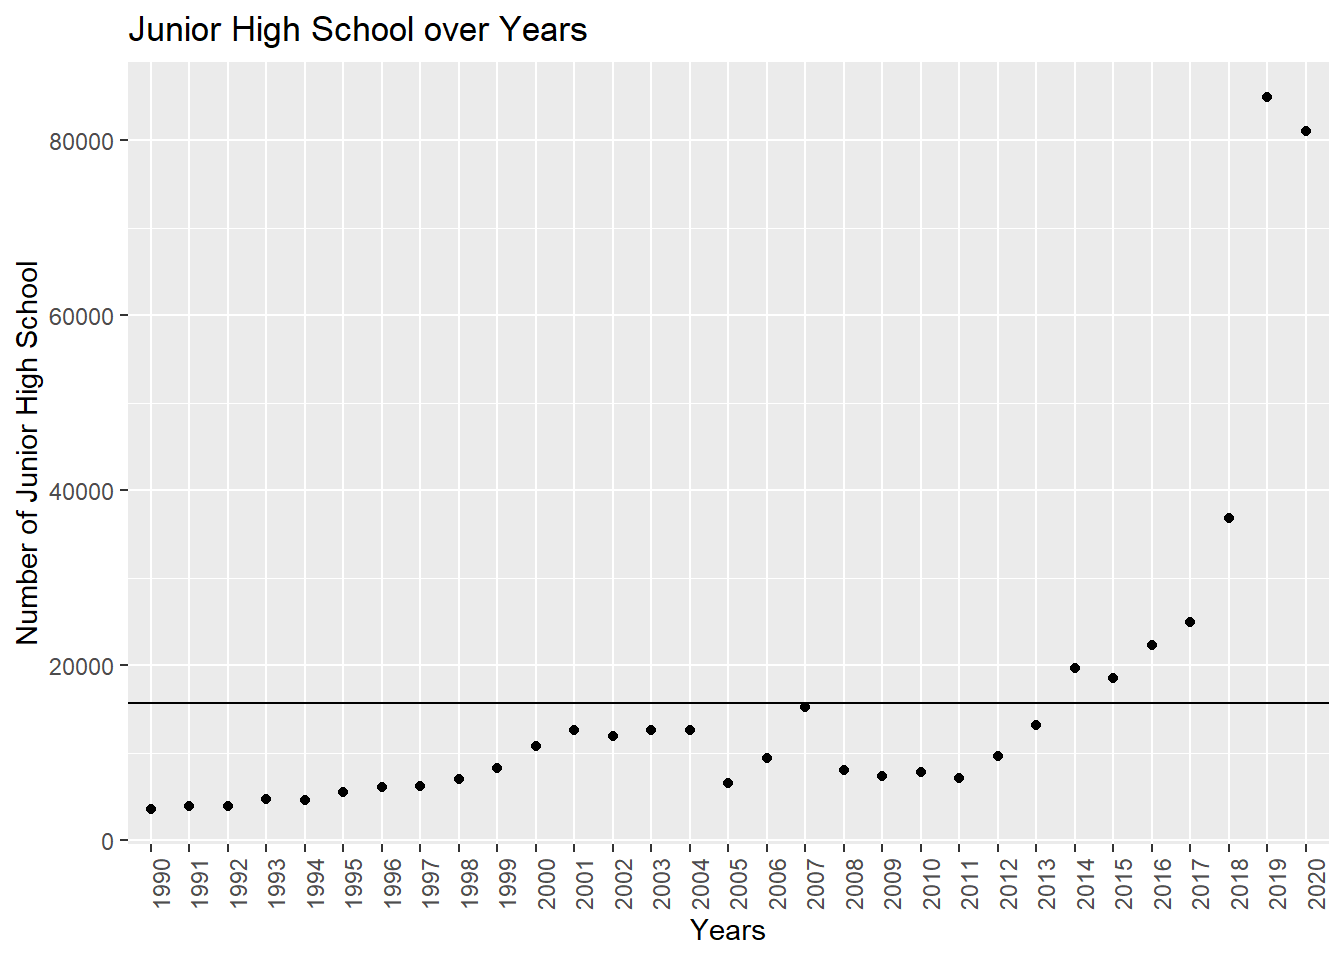
average_junior_high_school=mean(data_criminals$`Junior High School and Vocational School at Junior High School Level`)ggplot(data_criminals,aes(...1,data_criminals$`Junior High School and Vocational School at Junior High School Level`))+geom_point(color="black")+theme(axis.text.x =element_text(angle =90, hjust =1))+labs(title ="Junior High School over Years", x ="Years", y ="Number of Junior High School")+geom_hline(yintercept = average_junior_high_school, col ="black")
As seen on the table there is an increase trend after 2016. Their average is at the highest forth.
Code
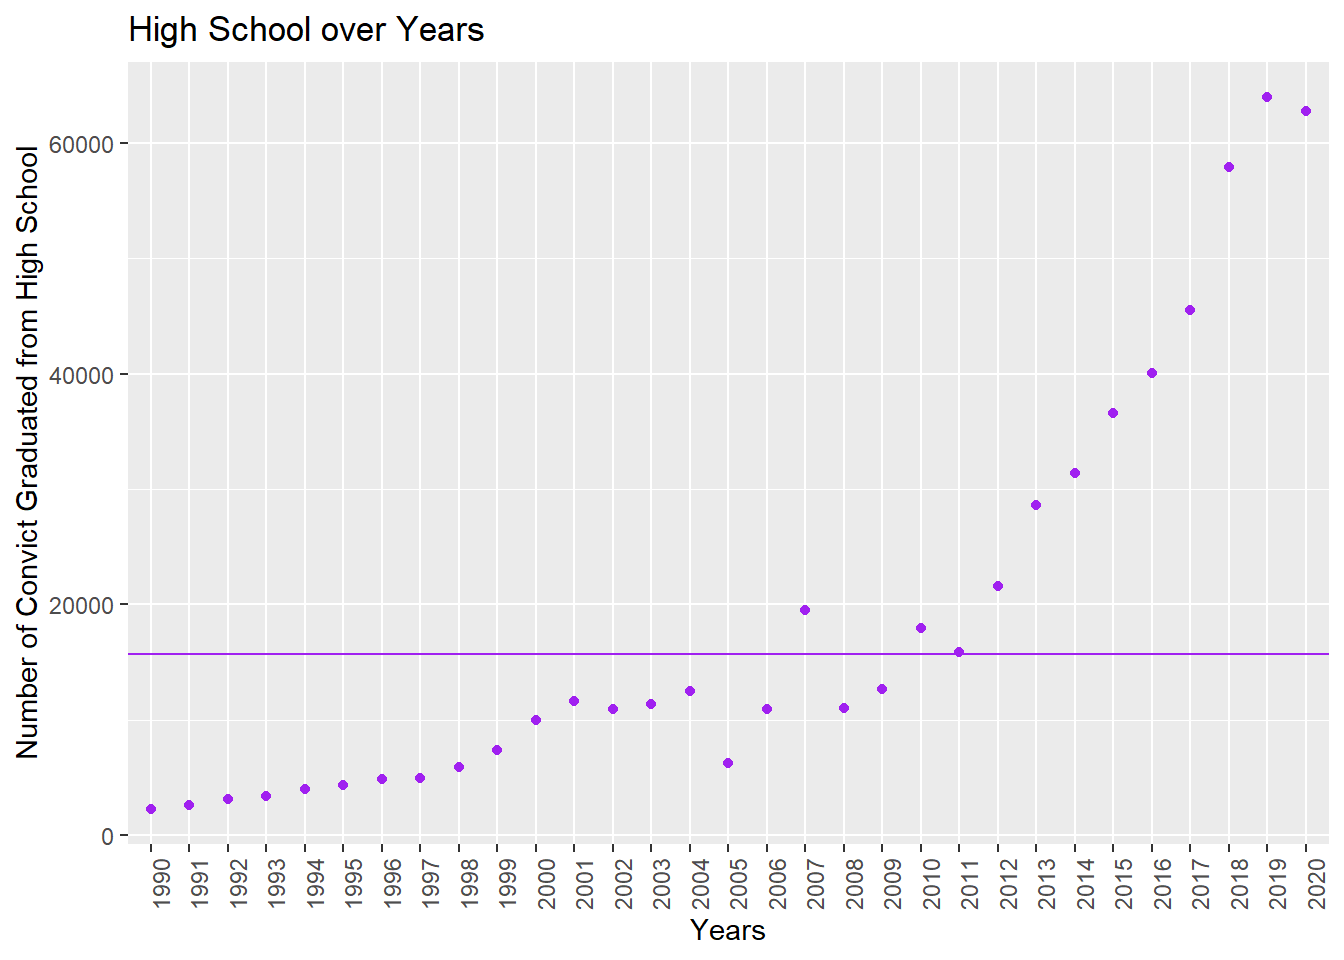
average_high_school=mean(data_criminals$`High School and Vocational School at High School Level`)ggplot(data_criminals,aes(...1,data_criminals$`High School and Vocational School at High School Level`))+geom_point(color="purple")+theme(axis.text.x =element_text(angle =90, hjust =1))+labs(title ="High School over Years", x ="Years", y ="Number of Convict Graduated from High School")+geom_hline(yintercept = average_junior_high_school, col ="purple")
Like junior high school numbers, convicts graduated from high school has an increase trend after 2011. Their average is at the highest 5.
Code
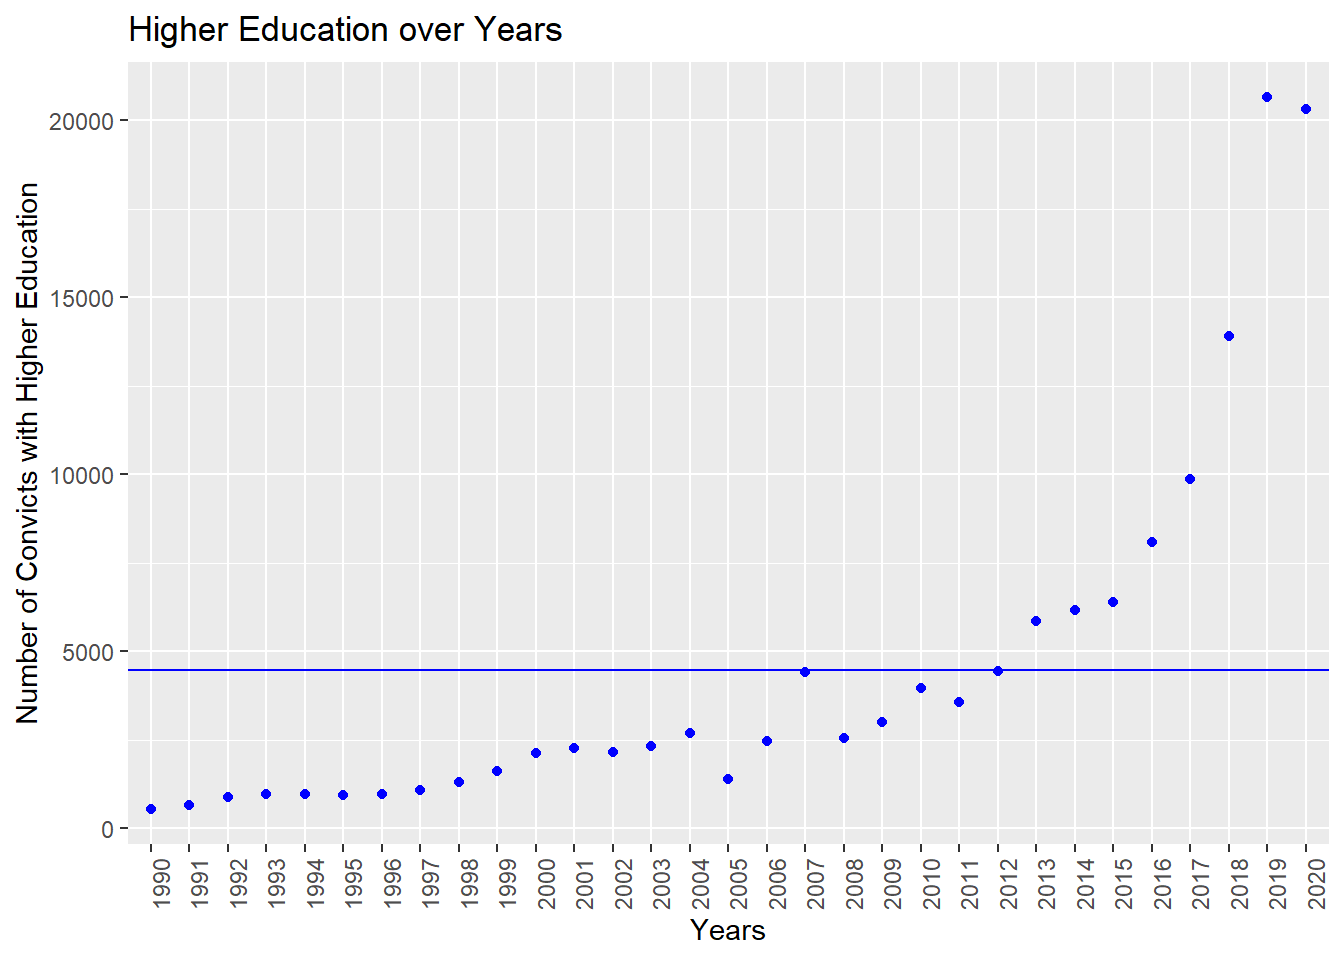
average_higher_edu=mean(data_criminals$`Higher Education`)ggplot(data_criminals,aes(...1,data_criminals$`Higher Education`))+geom_point(color="blue")+theme(axis.text.x =element_text(angle =90, hjust =1))+labs(title ="Higher Education over Years", x ="Years", y ="Number of Convicts with Higher Education")+geom_hline(yintercept =average_higher_edu , col ="blue")
Like High School there is a over-increase in the number of convicts who has higher education after 2016.
As we see in last three plot, there is a increase for Higher Education, High School and Junior High School after 2016. After failed coup attempt in 2016, many people were arrested because of political issues and it can be seen in plots. Fluctuation in some group can be seen in some plot. These fluctuations results from regulation in execution law, regulation in criminal law or probation.
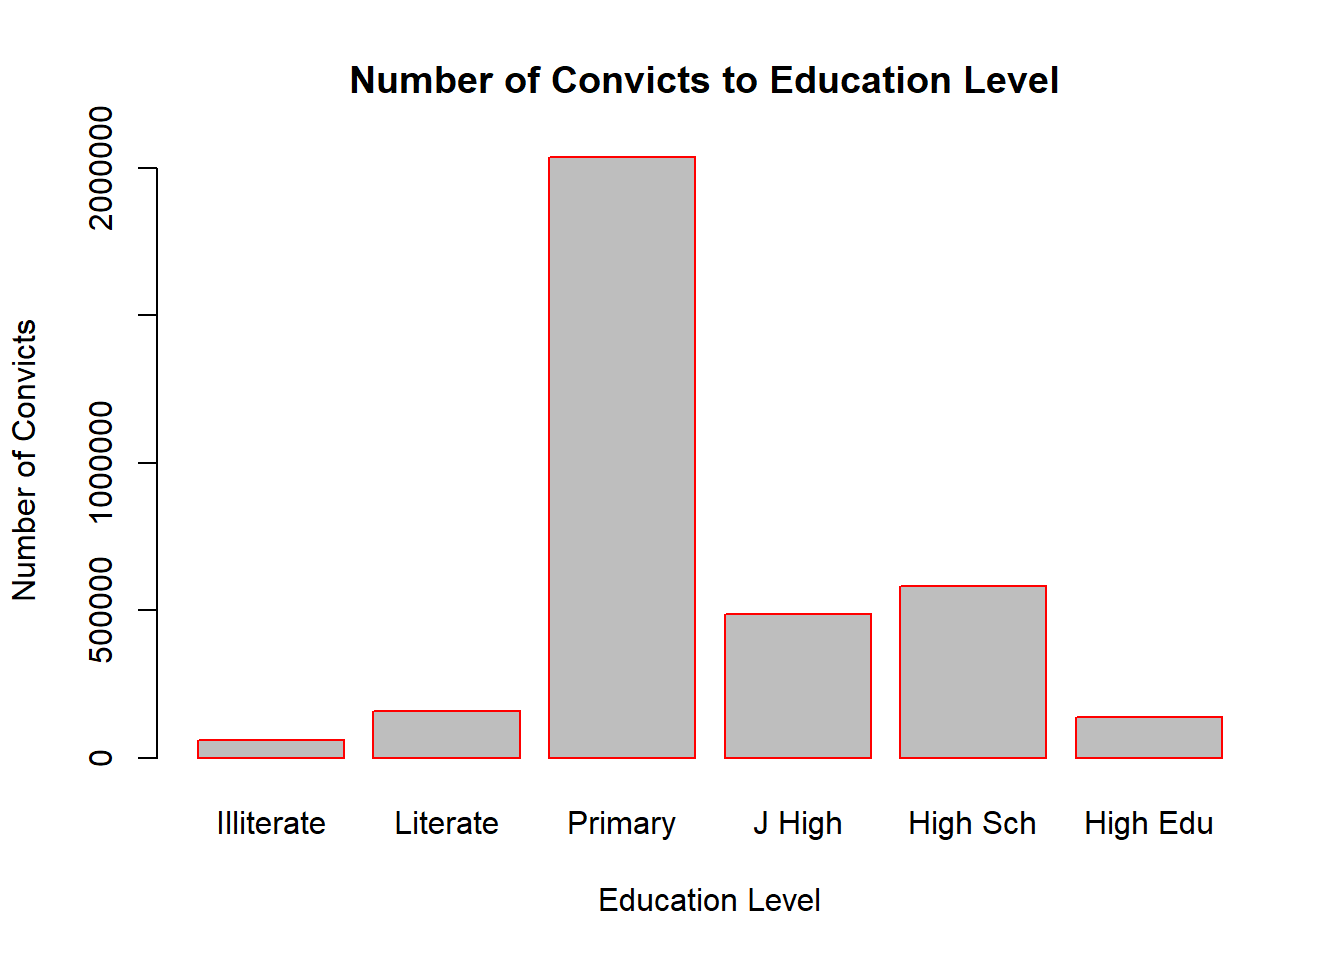
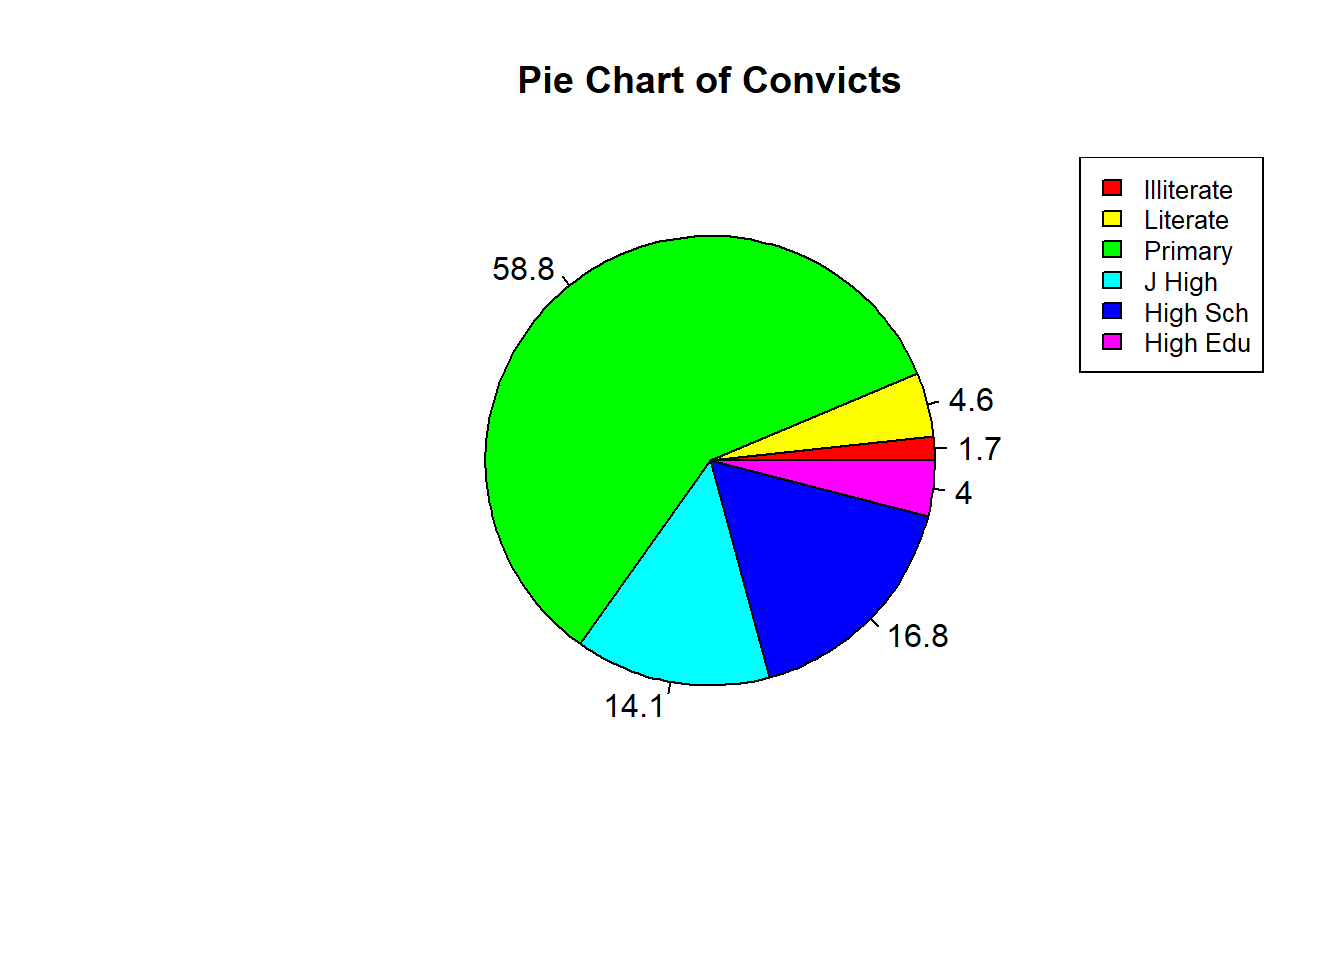
Plot shown above does not reflect result of our main objective. We want to illuminate correlation between education level and crime in Turkey prisons. Below you can see total number of each education level and their Pie chart presentation.
Code
total_ill=sum(data_criminals$Illiterate)total_lit=sum(data_criminals$`Literate but not Graduated from a School`)total_pri=sum(p$Primary)total_jhs=sum(data_criminals$`Junior High School and Vocational School at Junior High School Level`)total_hig=sum(data_criminals$`High School and Vocational School at High School Level`)total_uni=sum(data_criminals$`Higher Education`)vec=c(total_ill,total_lit,total_pri,total_jhs,total_hig,total_uni)names_vec=c("Illiterate","Literate","Primary","J High","High Sch","High Edu")names(vec)=names_vecbarplot(vec,main ="Number of Convicts to Education Level ", xlab ="Education Level", ylab ="Number of Convicts", border ="red")
As shown on both presentation, convicts education levels and their numbers between 1990-2020 according to TÜİK’s data, More than half of convicts has primary education. Illiterate and literate convicts make up only %6,3 of total number. Convicts, who have higher education, has only %4 and junior high school, high school have %14.1 %16.8 respectively. In order to be able to say that education level and probability to commit a crime inversely proportional we need more evidence. Proportions of education levels in society for each year can be useful for deep analytics. For example; what the rate of illiterate people of society for 1995 is can be helpful. Of course these are TÜİK’s data which calculated 2023’s inflation rate as %61,98. As Stalin said “The death of one person is a tragedy, the death of millions is a statistic” and everyone is a little bit manipulative.
---title: "Analysis"sidebar: falseformat: html: code-fold: true code-tools: true code-summary: "Show the code"---- ARE THE CONVICTS WELL EDUCATED?- IS THERE INCREASE TREND IN SPECIFIC PERIODS FOR SPECIFIC GROUPS?- WHY DO WE SEE FLUCTUATION IN SOME GROUP?In our society and through world there is a belief which claims convicts have low educational level. According to this belief, thanks to education, some values can be gained by children during school years. Is it really so? In this work we want to show some analysis and illuminate if there is a correlation between education level and probability of committing a crime with the data of TÜİK which include education level of convicts of Turkish prisons between 1990-2020. Our data include education level as variable (Illiterate, Literate but not Graduated from a school, Primary School, Primary Education, Junior High School and Vocational School at High School Level, Higher Education, Unknown) and years 1990-2020 as observations. Lines in each plot which are parallel to x axis point out average value of table's observations.```{r echo=T, results='hide', error=FALSE, warning=FALSE, message=FALSE}library(tidyverse)load("~/Github/emu430-fall2023-team-data_criminals/data_criminals.RData")average_illiterate=mean(data_criminals$Illiterate)ggplot(data_criminals,aes(...1,Illiterate))+geom_point(color="green")+theme(axis.text.x =element_text(angle =90, hjust =1))+labs(title ="Illiterate over Years", x ="Years", y ="Number of Illiterates")+geom_hline(yintercept = average_illiterate, col ="green")```As seen on the plot between 1997-2004 years there is a increase trend and in 2010, 2011, 2012 are lowest numbers for illiterate. We can see fluctuation over the years and interestingly compared to other education levels, number of illiterates has lowest average. Rates of illiterates of Turkey is important to make a interpretation and it is subject of another research. Our data provide only education level of convicts.```{r echo=T, results='hide', error=FALSE, warning=FALSE, message=FALSE}average_literates=mean(data_criminals$`Literate but not Graduated from a School`)ggplot(data_criminals,aes(...1,data_criminals$`Literate but not Graduated from a School` ))+geom_point(color="red")+theme(axis.text.x =element_text(angle =90, hjust =1))+labs(title ="Literate over Years", x ="Years", y ="Number of Literates")+geom_hline(yintercept = average_literates, col ="red")```When we look at the number of literates who have not graduated from a school, we can see increase after 2009 and their average find its position at third.```{r}data_criminals$`Primary Education`[is.na(data_criminals$`Primary Education`)] <-0p=data_criminals%>%mutate(Primary=`Primary School`+`Primary Education`)average_primary=mean(p$Primary)ggplot(p,aes(...1,Primary))+geom_point(color="brown")+theme(axis.text.x =element_text(angle =90, hjust =1))+labs(title ="Number of Graduated from Primary School or Education over Years", x ="Years", y ="Number of Primary Education or Primary Scool")+geom_hline(yintercept = average_primary, col ="brown")```In our data frame Primary Education and Primary School has 2 different column. We combined two column into one column as Primary. We can see fluctuation over years and increase after 2016. Most probably, sharp decline after 2018 results from regulation in execution law because of COVID-19 pandemic. This group has the highest average.```{r echo=T, error=FALSE, message=FALSE, warning=FALSE, results='hide'}average_junior_high_school=mean(data_criminals$`Junior High School and Vocational School at Junior High School Level`)ggplot(data_criminals,aes(...1,data_criminals$`Junior High School and Vocational School at Junior High School Level`))+geom_point(color="black")+theme(axis.text.x =element_text(angle =90, hjust =1))+labs(title ="Junior High School over Years", x ="Years", y ="Number of Junior High School")+geom_hline(yintercept = average_junior_high_school, col ="black")```As seen on the table there is an increase trend after 2016. Their average is at the highest forth.```{r echo=T, results='hide', error=FALSE, warning=FALSE, message=FALSE}average_high_school=mean(data_criminals$`High School and Vocational School at High School Level`)ggplot(data_criminals,aes(...1,data_criminals$`High School and Vocational School at High School Level`))+geom_point(color="purple")+theme(axis.text.x =element_text(angle =90, hjust =1))+labs(title ="High School over Years", x ="Years", y ="Number of Convict Graduated from High School")+geom_hline(yintercept = average_junior_high_school, col ="purple")```Like junior high school numbers, convicts graduated from high school has an increase trend after 2011. Their average is at the highest 5.```{r echo=T, results='hide', error=FALSE, warning=FALSE, message=FALSE}average_higher_edu=mean(data_criminals$`Higher Education`)ggplot(data_criminals,aes(...1,data_criminals$`Higher Education`))+geom_point(color="blue")+theme(axis.text.x =element_text(angle =90, hjust =1))+labs(title ="Higher Education over Years", x ="Years", y ="Number of Convicts with Higher Education")+geom_hline(yintercept =average_higher_edu , col ="blue")```Like High School there is a over-increase in the number of convicts who has higher education after 2016.As we see in last three plot, there is a increase for Higher Education, High School and Junior High School after 2016. After failed coup attempt in 2016, many people were arrested because of political issues and it can be seen in plots. Fluctuation in some group can be seen in some plot. These fluctuations results from regulation in execution law, regulation in criminal law or probation.Plot shown above does not reflect result of our main objective. We want to illuminate correlation between education level and crime in Turkey prisons. Below you can see total number of each education level and their Pie chart presentation.```{r echo=T, results='hide', error=FALSE, warning=FALSE, message=FALSE}total_ill=sum(data_criminals$Illiterate)total_lit=sum(data_criminals$`Literate but not Graduated from a School`)total_pri=sum(p$Primary)total_jhs=sum(data_criminals$`Junior High School and Vocational School at Junior High School Level`)total_hig=sum(data_criminals$`High School and Vocational School at High School Level`)total_uni=sum(data_criminals$`Higher Education`)vec=c(total_ill,total_lit,total_pri,total_jhs,total_hig,total_uni)names_vec=c("Illiterate","Literate","Primary","J High","High Sch","High Edu")names(vec)=names_vecbarplot(vec,main ="Number of Convicts to Education Level ", xlab ="Education Level", ylab ="Number of Convicts", border ="red")``````{r echo=T, results='hide', error=FALSE, warning=FALSE, message=FALSE}rates_of=c("1.7","4.6","58.8","14.1","16.8","4")pie(vec, labels = rates_of, main="Pie Chart of Convicts" ,col =rainbow(length(vec)))legend("topright", names_vec, cex =0.8,fill =rainbow(length(vec)))```As shown on both presentation, convicts education levels and their numbers between 1990-2020 according to TÜİK's data, More than half of convicts has primary education. Illiterate and literate convicts make up only %6,3 of total number. Convicts, who have higher education, has only %4 and junior high school, high school have %14.1 %16.8 respectively. In order to be able to say that education level and probability to commit a crime inversely proportional we need more evidence. Proportions of education levels in society for each year can be useful for deep analytics. For example; what the rate of illiterate people of society for 1995 is can be helpful. Of course these are TÜİK's data which calculated 2023's inflation rate as %61,98. As Stalin said "The death of one person is a tragedy, the death of millions is a statistic" and everyone is a little bit manipulative.