The Türkiye Health Survey wants to find out how healthy people are and collect important information about key health measures. It helps compare health internationally and gives insights into what health needs a country has for its development.
We picked the ‘Türkiye Health Survey’ data set for our EMU430 course because it’s interesting and fits well with what we’re learning. This data set gives us a lot of information about health in Turkey. We can study things like how people take care of their health, how much alcohol they drink, what common diseases there are, and the body mass index of individuals. It’s a good choice for our course because it covers a lot of important health topics in Turkey.
1.2 Our Objectives
Our main goal is to study how people’s health changes with age and differs between men and women. We want to understand how behaviors and diseases vary based on these factors. By doing this research, we hope to gather useful information that can be used to create better health policies and strategies.
Our plan is to use numbers and graphs to look for patterns and differences in the data. We believe that showing our findings visually will make them easier to understand. But before we start, we need to make sure the information we have is correct and complete. We’ll check and fix any mistakes or missing details to ensure that our results can be trusted. Following this plan, we aim to make our project’s goals, the data we’re using, and how we’re studying it clear. This will set a strong foundation for our project to move forward successfully.
2 Importing and Preprocessing Data: Our Approach
Before importing our data, we manually cleaned it by removing Turkish text and unnecessary information. Then, we used the ‘dplyr’ and ‘tidyr’ packages to improve our understanding of the data. The relevant code is provided below.
This study includes three data-sets:
2.1Percentage of Health Problems in the Last 12 Months by Sex, 2016-2022
In the data pre-processing phase, we used ChatGPT to provide necessary functions and increase the quality of our content. Some of the functions are: “mutate_at”, “na.omit”, “gsub”.
3 Exploratory Data Analysis
In our project, we are working on three data sets, all of which were sourced from the Turkish Statistical Institute’sTürkiye Health Survey that was conducted in 2022.
3.1 Dataset 1 : The Percentage of Main Diseases/Health Problems Declared by Individuals in the Last 12 Months by Sex, 2016-2022
This data set showcases the percentage of health problems by sex. Only people over the age of 15 were considered for the study, and Alzheimer was evaluated for individuals in the 65+ age group.
The Percentage of Main Diseases/Health Problems Declared by Individuals in the Last 12 Months by Sex
Diseases
Gender
Year
Percentage
Allergy
men
2016
7.540591
Allergy
men
2019
8.926597
Allergy
men
2022
6.566730
Allergy
women
2016
13.900246
Allergy
women
2019
15.621691
Allergy
women
2022
12.518126
Alzheimer
men
2016
5.095686
Alzheimer
men
2019
5.955258
Alzheimer
men
2022
5.069767
Alzheimer
women
2016
6.065594
Alzheimer
women
2019
6.008264
Alzheimer
women
2022
5.824677
Arthrosis
men
2016
4.858361
Arthrosis
men
2019
7.636946
Arthrosis
men
2022
4.863095
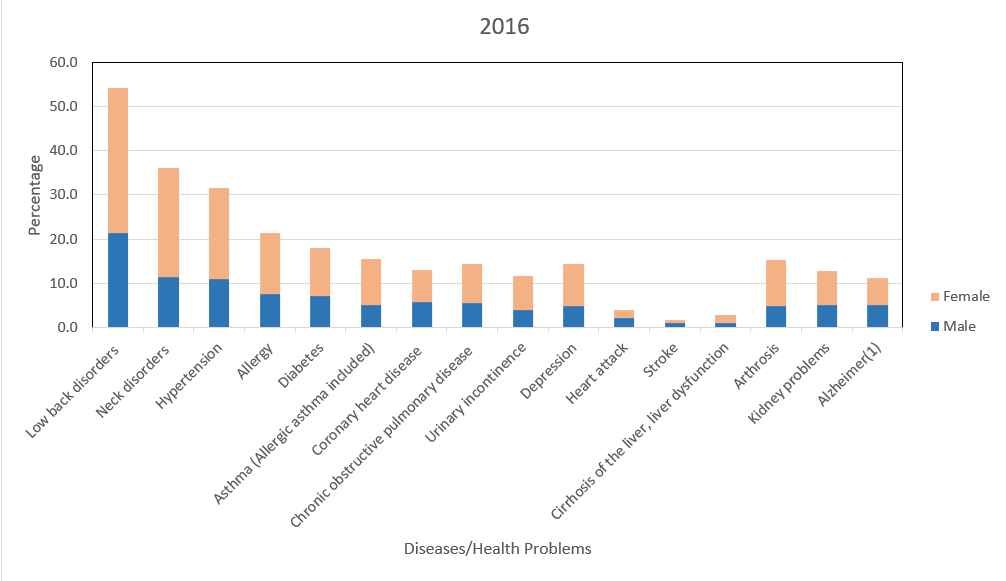
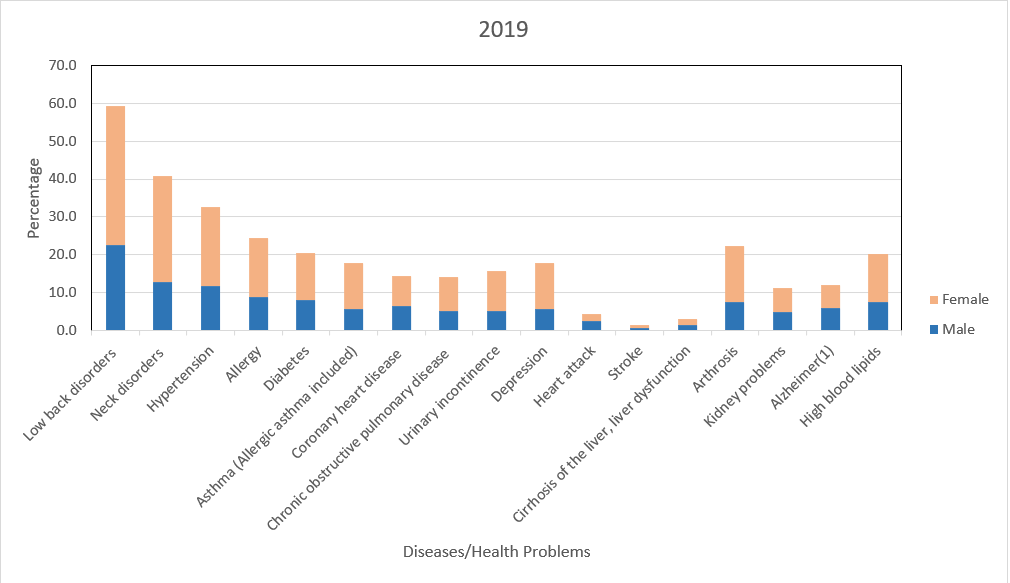
The first column, titled Diseases corresponds to the diseases, and the following columns represent the gender of the individual, the year the data was collected and the percentage information respectively. If we take a look at the visualization of the data as presented below we can see that low back problems are consistently what causes the most issues, in both men and women. In general, women have declared their health problems more than men for all years that were considered for the study.
The distribution of declared health problems for both genders, 2016
The distribution of declared health problems for both genders, 2019
The distribution of declared health problems for both genders, 2022
3.2 Data Set 2 : The Percentage of Individuals’ Status of Alcohol Use by Sex and Age Group, 2016-2022
This data set showcases the percentage of individuals’ alcohol consumption status by sex and age group.
The first column of the table below shows the various age ranges from the study, starting from age 15 and going all the way up to 75+.
The second column, titled usage, has three different field values: *Consumers: Indicates the individual partakes in regular alcohol consumption. *Doesn’t consume: Means the individual has consumed alcohol before, but not anymore/not regularly. *Never consume: Indicates the individual has never consumed alcohol before.
The Percentage of Individuals' Status of Alcohol Use by Sex and Age Group
Age
User Type
Gender
Year
Percentage
15-24
Consumers
men
2016
13.0800576
15-24
Consumers
men
2019
16.3688405
15-24
Consumers
men
2022
11.5901638
15-24
Consumers
women
2016
5.4064093
15-24
Consumers
women
2019
6.2480878
15-24
Consumers
women
2022
4.9318588
15-24
Doesn't consume
men
2016
5.9217499
15-24
Doesn't consume
men
2019
5.7362602
15-24
Doesn't consume
men
2022
2.3365367
15-24
Doesn't consume
women
2016
3.9478235
15-24
Doesn't consume
women
2019
3.0067650
15-24
Doesn't consume
women
2022
0.8584534
15-24
Never consume
men
2016
80.9981924
15-24
Never consume
men
2019
77.8948993
15-24
Never consume
men
2022
86.0732995
The third column shows the gender of the individuals that took part in the study, followed by the year on column 4 and the percentages on column 5.
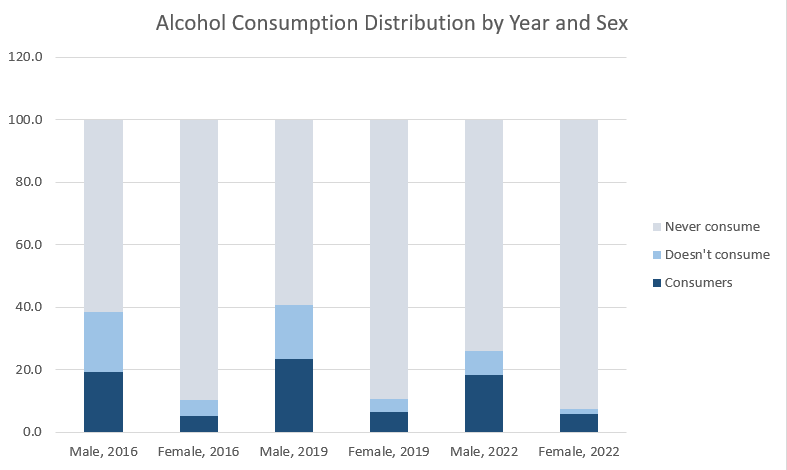
We can further understand this data by visualizing it via a bar chart, as shown below.
The distribution of alcohol consumption habits for both genders; 2016, 2019, 2022
3.3 Data Set 3 : Body Mass Index Distribution of Individuals by Sex, 2008-2022
This data set showcases the body mass index distribution of male and female individuals, as well as a total for the year of each sub-study. The data here was collected every two years starting from 2008, and ending at 2022.
Body Mass Index Distribution of Individuals by Sex
Year
Sex
Category
Percentage
2008
Male
Underweight
2.70
2008
Male
Normal_weight
48.10
2008
Male
Pre_Obese
36.90
2008
Male
Obese
12.30
2008
Female
Underweight
5.90
2008
Female
Normal_weight
48.20
2008
Female
Pre_Obese
27.40
2008
Female
Obese
18.50
2010
Male
Underweight
3.46
2010
Male
Normal_weight
46.12
2010
Male
Pre_Obese
37.26
2010
Male
Obese
13.16
2010
Female
Underweight
5.93
2010
Female
Normal_weight
44.73
2010
Female
Pre_Obese
28.39
The first column has year information. The second column indicates whether the individual is male or female. Category column has four field values:
Underweight
Normal weight
Pre-obese
Obese
The last column showcases the percentage information.