Crime Dynamics: Analyzing Crime Rates, Gender, and Education Trends from 2011 to 2020
Our project will focus on the relationships between the gender and education levels of those who committed crimes in Turkey between 2011 and 2020, and in this context, it aims to help us better understand the sensitivity of crime to population-related characteristics.
Crime is a complex issue that affects the order and security of societies. Therefore, understanding changes in crime rates and uncovering the reasons behind these changes form the basis of creating effective crime-fighting strategies.
The main reason we chose this data is to understand the social impact by analyzing changes in crime rates and to determine crime profiles by examining the demographic characteristics of criminals. A comprehensive analysis that includes variables such as crime types, gender and education level will contribute to the development of more effective policies in the fight against crime.
First of all, we will examine in detail the changes in the rates of certain types of crimes. We aim to obtain a more detailed output about the security situation of the society by analyzing trends in crime categories such as theft, murder and rape.
Gender and education level are important factors in understanding the crime profile. Our study will focus on the relationships between gender and education levels of offenders and, in this context, will help us better understand the sensitivity of crime to demographic characteristics. The types of analysis aimed in the project consist of determining which crime types are more common in which year using Descriptive Statistics, observing which crime types a certain gender is more prone to and how their trends change over the year with Gender-Based Analysis, observing how the number of crime types changes over time with Time-Series Analysis, analyzing how a certain crime type depends on factors such as gender and year with Regression Analysis.
The resulting analyzes can contribute to efforts to create a safer society by providing information on identifying the factors underlying crime.
Overview of Structure
While the original data holds the education information, our version that is exported as the RData file omits it for now. The code we used to work on the data is as follows:
In order to make the data easier to work on, we have used the packages readxl, tidyr, and dplyr. Using readxl to access the data from its excel file format, and rest to process the exported data chunk by chunk so we could rid the data from its NA filled, unplottable structure.
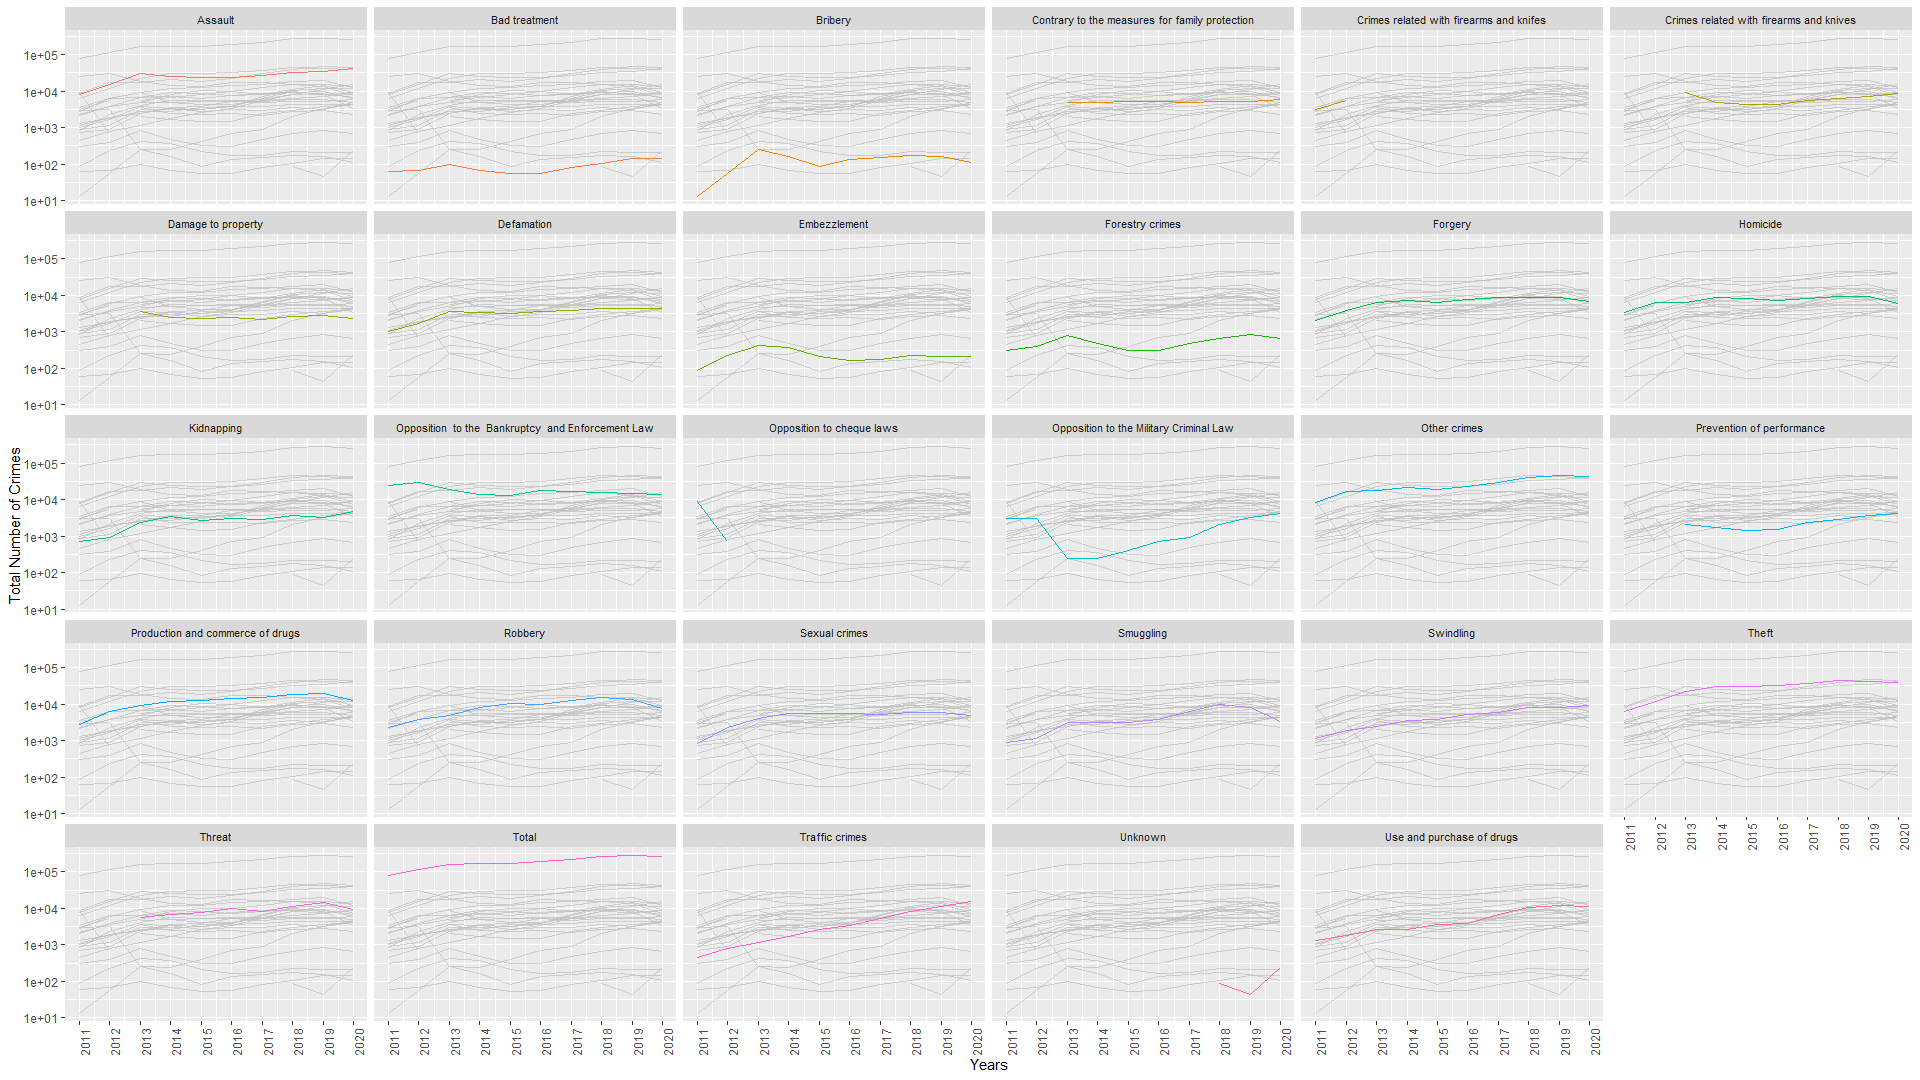
Some ways the data is categorized can be seen by looking into this plot:
Don’t be shy to open the image in a new tab so you can zoom in on it!
So, as it can be seen from the plot, the types of crimes that are present in the data are given as the titles of the individual line plots. The x axis is years for each type of crime and y axis is the number of times that crime was committed, of course. The plot piece named “Total” is the total amount of times all crimes were committed.
Some of the crimes start or end abruptly as there are types of crimes redacted or added throughout the years such as “Opposition to cheque laws” which was only judged in 2011 and 2012.
Y axis of our plot is logarithmically scaled to compensate for the difference between the total number of times all the crimes for committed (Total) and the number of times different types of crimes were committed.
Warning
Help from ChatGPT has been used to cut back from time googling very specific data formatting problems. More context can be provided if needed.