Since I was a child, I’ve always loved math. It’s made me good with numbers and helped me think analytically and solve problems. Throughout my university education, I have furthered my skills in various areas such as operations research, optimization and modeling, data analysis, and coding. Additionally, through academic and social responsibilities. I’ve developed strong teamwork, leadership, and problem-solving skills. As a talented and eager-to-learn engineering prospect, I am seeking an internship opportunity where I can continue to enhance my abilities.
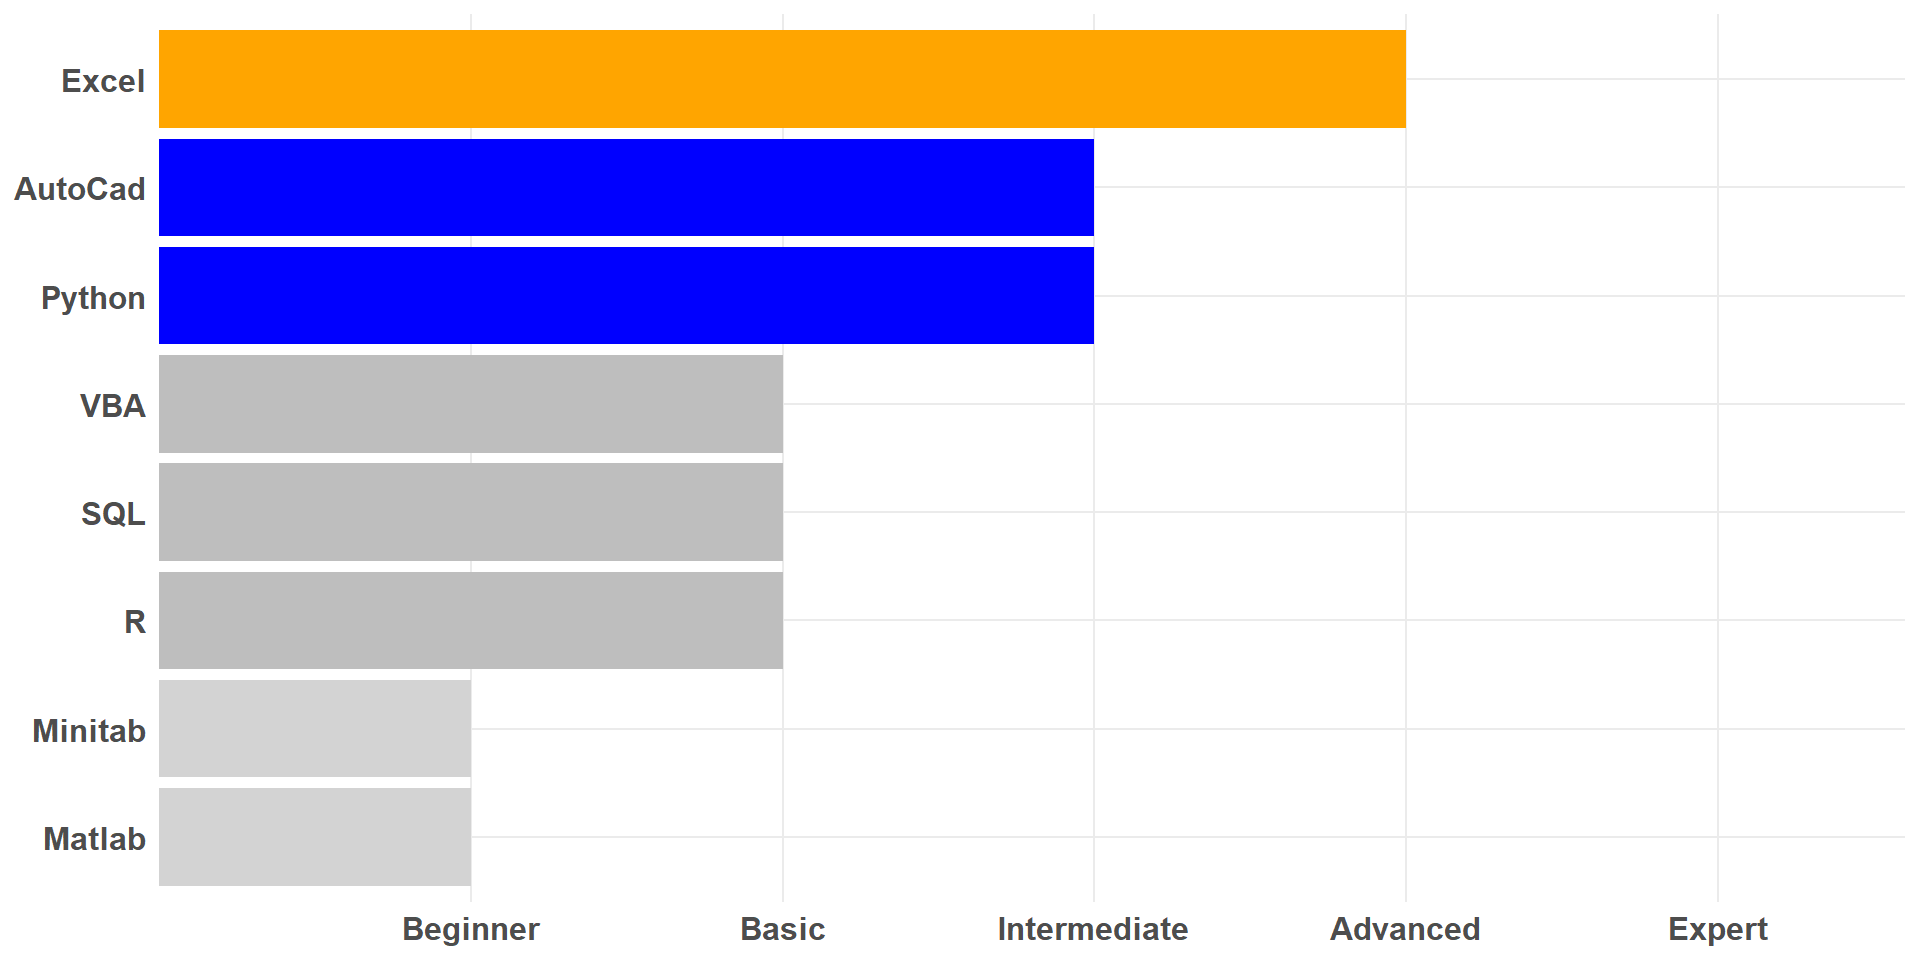
---title: "About Me"author: Kubilay Ustaformat: html: code-tools: true code-fold: true---- Since I was a child, I've always loved math. It's made me good with numbers and helped me think analytically and solve problems. Throughout my university education, I have furthered my skills in various areas such as operations research, optimization and modeling, data analysis, and coding. Additionally, through academic and social responsibilities. I've developed strong teamwork, leadership, and problem-solving skills. As a talented and eager-to-learn engineering prospect, I am seeking an internship opportunity where I can continue to enhance my abilities.# Education- B.S., Industrial Engineering, Hacettepe University, Turkey, 2020 - ongoing.# Internships- TUSAŞ- HAVELSAN# ProjectsNone# Competencies```{r, fig.width=10, fig.height=5}#| code-fold: truelibrary(ggplot2)# Örnek veridata <- data.frame( Skill = c("Python", "R", "Excel", "SQL", "VBA", "AutoCad", "Matlab", "Minitab"), Point = c("Intermediate", "Basic", "Advanced", "Basic", "Basic", "Intermediate", "Beginner", "Beginner"))# 'Point' sütununu faktör olarak tanımlama ve sıralamadata$Point <- factor(data$Point, levels = c("Beginner", "Basic", "Intermediate", "Advanced", "Expert"))# 'Skill' sütununu 'Point' sıralamasına göre sıralamadata$Skill <- factor(data$Skill, levels = data$Skill[order(data$Point)])# ggplot ile grafik oluşturmaggplot(data, aes(x = Skill, y = Point, fill = Point)) + geom_bar(stat = "identity") + coord_flip() + scale_fill_manual(values = c("Beginner" = "lightgrey", "Basic" = "grey", "Intermediate" = "blue", "Advanced" = "orange", "Expert" = "red")) + scale_y_discrete(limits = c("Beginner", "Basic", "Intermediate", "Advanced", "Expert")) + theme_minimal() + theme( axis.text.y = element_text(size = 12, face = "bold"), axis.text.x = element_text(size = 12, face = "bold"), plot.title = element_text(size = 16, face = "bold", hjust = 0.5), legend.position = "none" ) + labs(title = NULL, x = NULL, y = NULL)```# HobbiesComputer GamesListen to MusicHikingDiscussionIntelligence GamesFitness# CVYou can see my CV from this link:[Kubilay Usta CV](KubilayUstaCV.pdf){.download-button}[Python for DataScience.](pythonfordatascience.pdf){.download-button}[What is Data Science.](whatisdatascience.pdf){.download-button}[EuroPower Layout Design.](EuroPower.pdf){.download-button}