I don’t think there is someone haven’t watched one of these movies yet. I guess everybody would agree upon these 5. There are many great actors/actresses that make us laugh even today. The second one is actually not a movie though.
Tail
The bottom 5 is shown below.
Code
tail(movies, n = 5L) %>%select(title, rating, vote)
                             title rating  vote
466                 Cumali Ceber 2    1.2 10228
467                          Müjde    1.2  9920
468              15/07 Safak Vakti    1.2 20606
469 Cumali Ceber: Allah Seni Alsin    1.0 39266
470                           Reis    1.0 73972
Judging a movie before watching it is not appropriate. So, I have no comments about these movies.
b)My Favorite Ones
My favorite 3 movies, their rankings and ratings are listed below.
Code
movies %>%filter(title =="Dag II"| title =="A.R.O.G"| title =="Kurtlar Vadisi: Gladio")
  ranking                  title release_year duration rating   vote
1      24                 Dag II         2016      135    8.2 109865
2     136                A.R.O.G         2008      127    7.3  44631
3     311 Kurtlar Vadisi: Gladio         2009       97    6.2   5288
c) Visualization
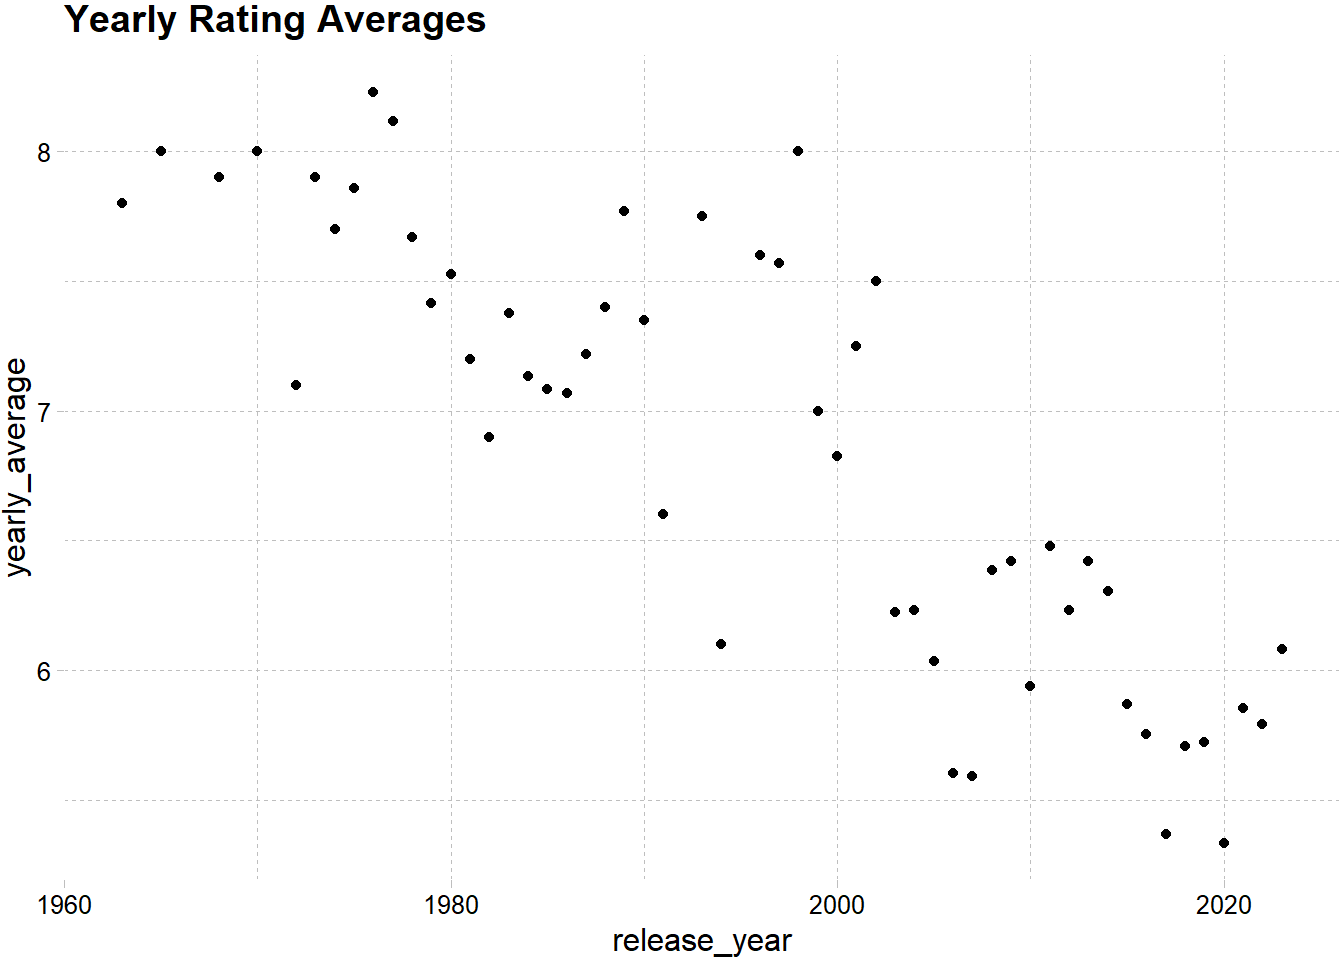
Yearly rating averages are visualized below. You can see that rating averages are decreasing as getting closer to today. However, one need consider the number of movies released since it is directly related with the rating averages.
Code
movies %>%group_by(release_year) %>%summarize(yearly_average =mean(rating)) %>%ggplot(aes(x = release_year, y = yearly_average)) +geom_point() +ggtitle("Yearly Rating Averages") +theme_pander()
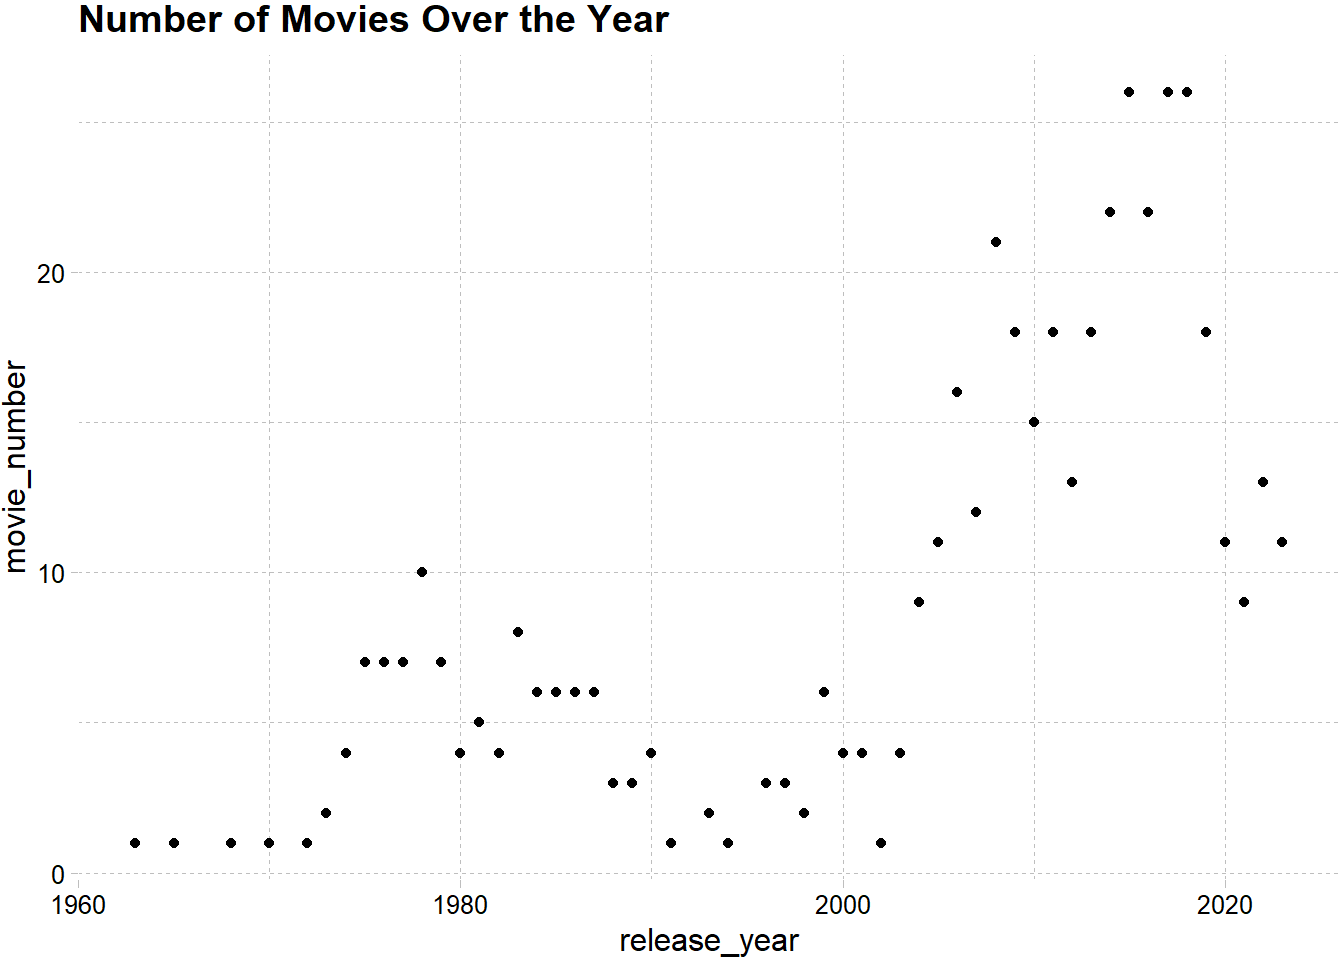
Below you can see that number of movies released are generally increased over the years.
Code
movies %>%group_by(release_year) %>%summarize(movie_number =n()) %>%ggplot(aes(x = release_year, y = movie_number)) +geom_point() +ggtitle("Number of Movies Over the Year") +theme_pander()
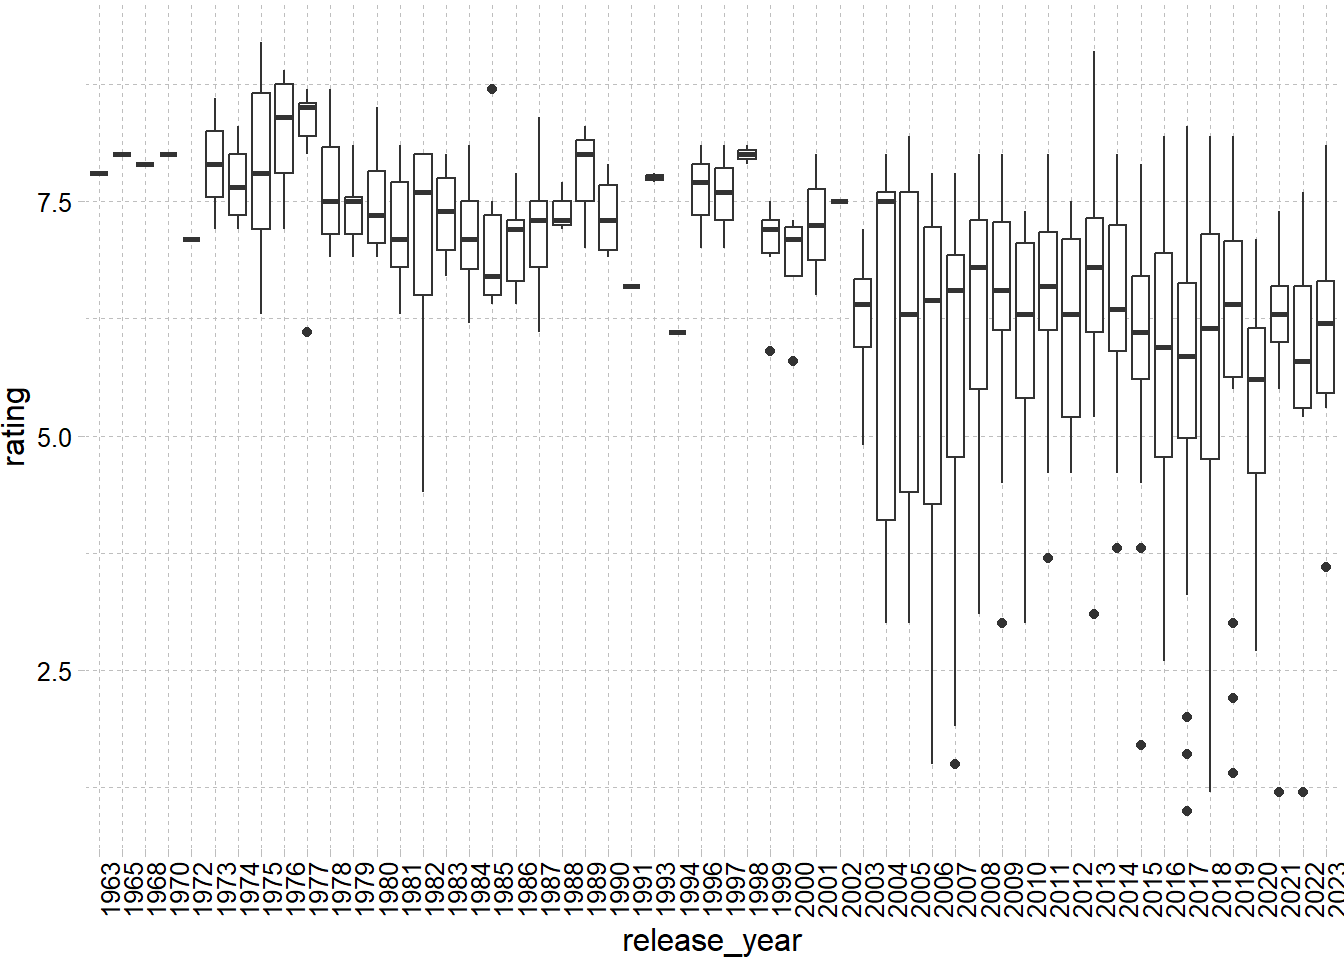
Box Plot
Code
movies %>%ggplot(aes(x =as.factor(release_year), y = rating)) +geom_boxplot() +theme_pander() +theme(axis.text.x =element_text(angle =90, hjust =1))+xlab("release_year")
After 2003 number of movies increased dramatically and results relatively lower ratings.
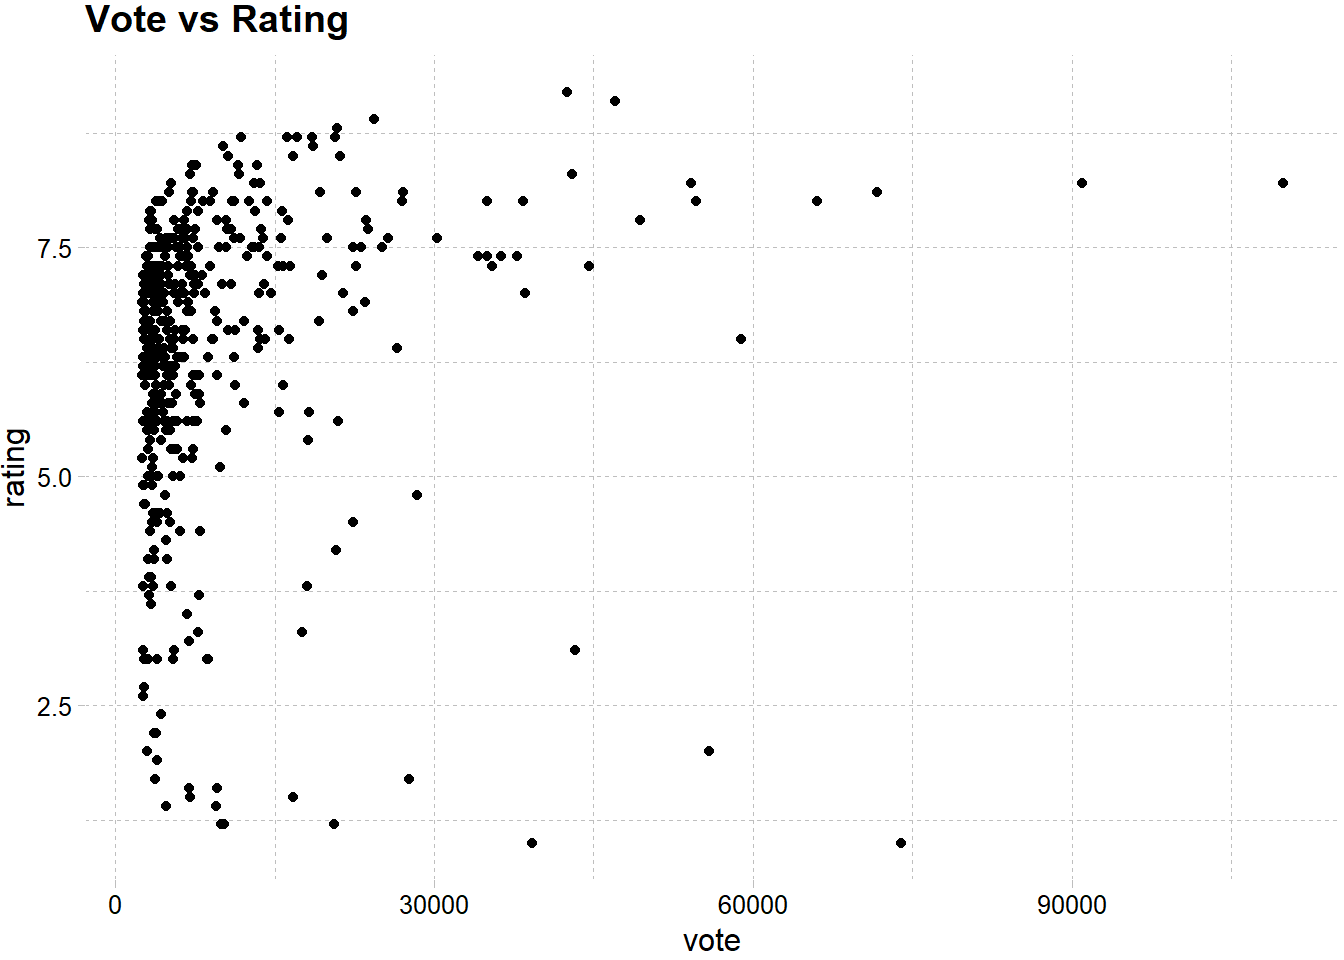
Vote vs Rating
Code
movies %>%ggplot(aes(x = vote, rating)) +geom_point() +theme_pander()+ggtitle("Vote vs Rating")
Most of the votes within the range of 0 and 15000. In this range there is accumulation above 5.0 rating. As the number of votes increases rating is generally high. However further investigation with larger dataset is required.
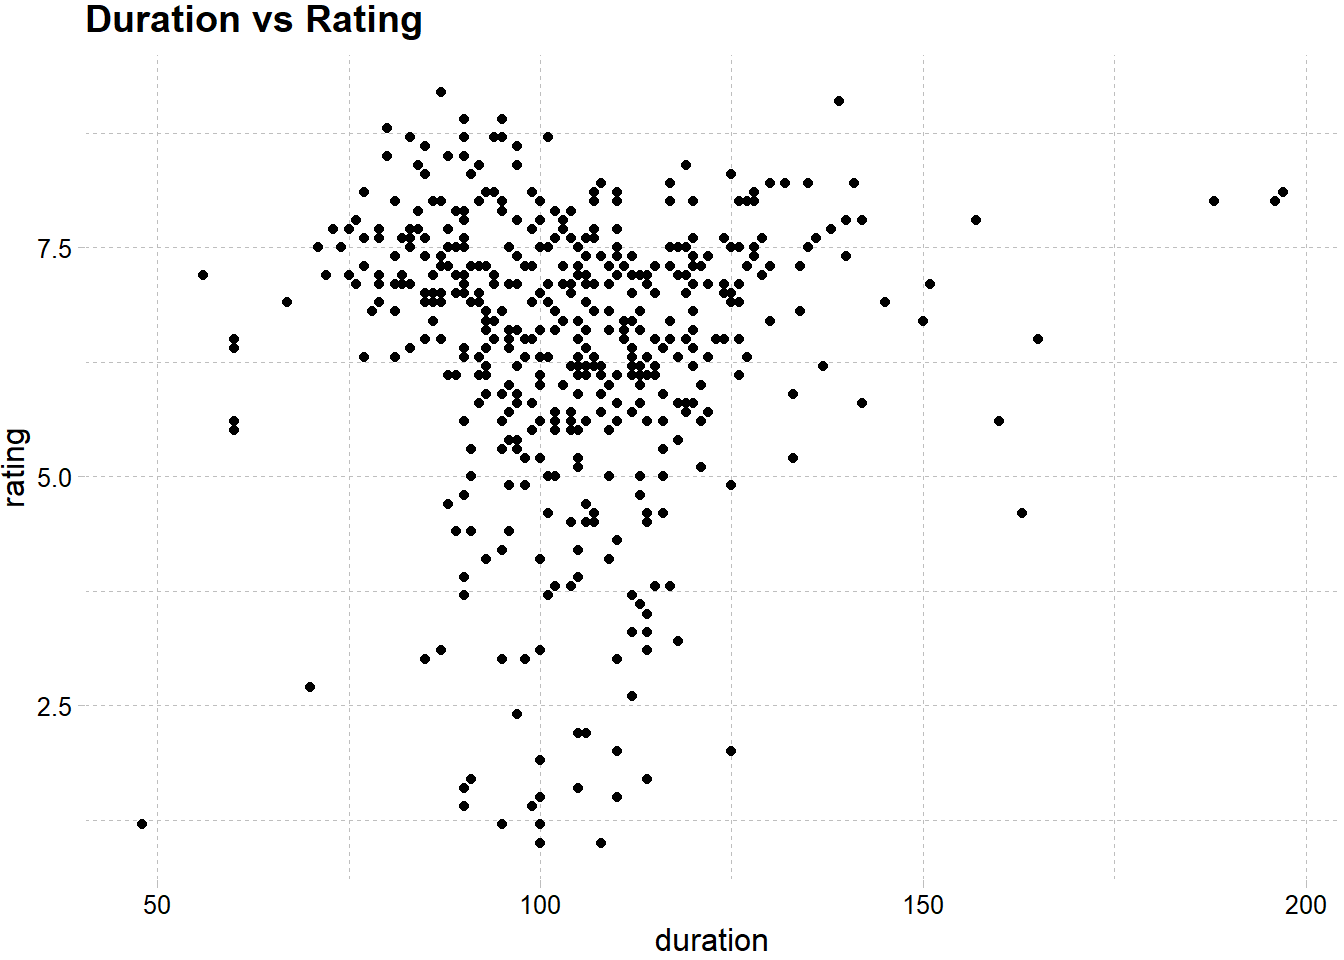
Duration vs Rating
Code
movies %>%ggplot(aes(x = duration, rating)) +geom_point() +theme_pander()+ggtitle("Duration vs Rating")
Duration of the movies are accumulated between roughly 75-130 minutes. However in this range we can see both high and low ratings. Hence, there is not clear relationship between duration and rating.
left_join(movies_top, movies, by =c("title_top"="title")) %>%select(-release_year_top) %>%select(ranking, everything()) %>%arrange(desc(rating))
# A tibble: 11 × 6
   ranking title_top                 release_year duration rating  vote
     <int> <chr>                            <dbl>    <dbl>  <dbl> <dbl>
 1      20 Ayla: The Daughter of War         2017      125    8.3 42989
 2      23 Yedinci Kogustaki Mucize          2019      132    8.2 54151
 3      27 Babam ve Oglum                    2005      108    8.2 91021
 4      31 Eskiya                            1996      128    8.1 71698
 5      32 Her Sey Çok Güzel Olacak          1998      107    8.1 27119
 6      37 Kis Uykusu                        2014      196    8   54631
 7      40 Nefes: Vatan Sagolsun             2009      128    8   35015
 8      38 Ahlat Agaci                       2018      188    8   26995
 9      42 G.O.R.A.                          2004      127    8   66027
10      44 Vizontele                         2001      110    8   38398
11      58 Bir Zamanlar Anadolu'da           2011      157    7.8 49348
The ranking shows the actual place of these movies in the movies dataset. Although they are in the top 1000 list of IMDB, they are not at the top of first dataframe. Hence, we can say that IMDB has some other parameters to order the movies in its top 1000 lists. These parameters can be awards they took, tickets sold etc.